70+ Social Media Statistics That Matter for Social Media Marketers

Social media has become more than a place to share birthday photos and connect with friends. It’s turned into a powerful tool for owners and marketers to reach new audiences and promote their businesses.
We’ve put together a list of the latest social media statistics to help you decide the best social media marketing strategy for your business — whether you’re looking to go multi-channel or deciding which type of social media you want to add to improve your marketing efforts.
General Social Media Marketing Statistics
People all around the world are active on social media. In fact, nearly a third of the global population uses one of the many sites available.
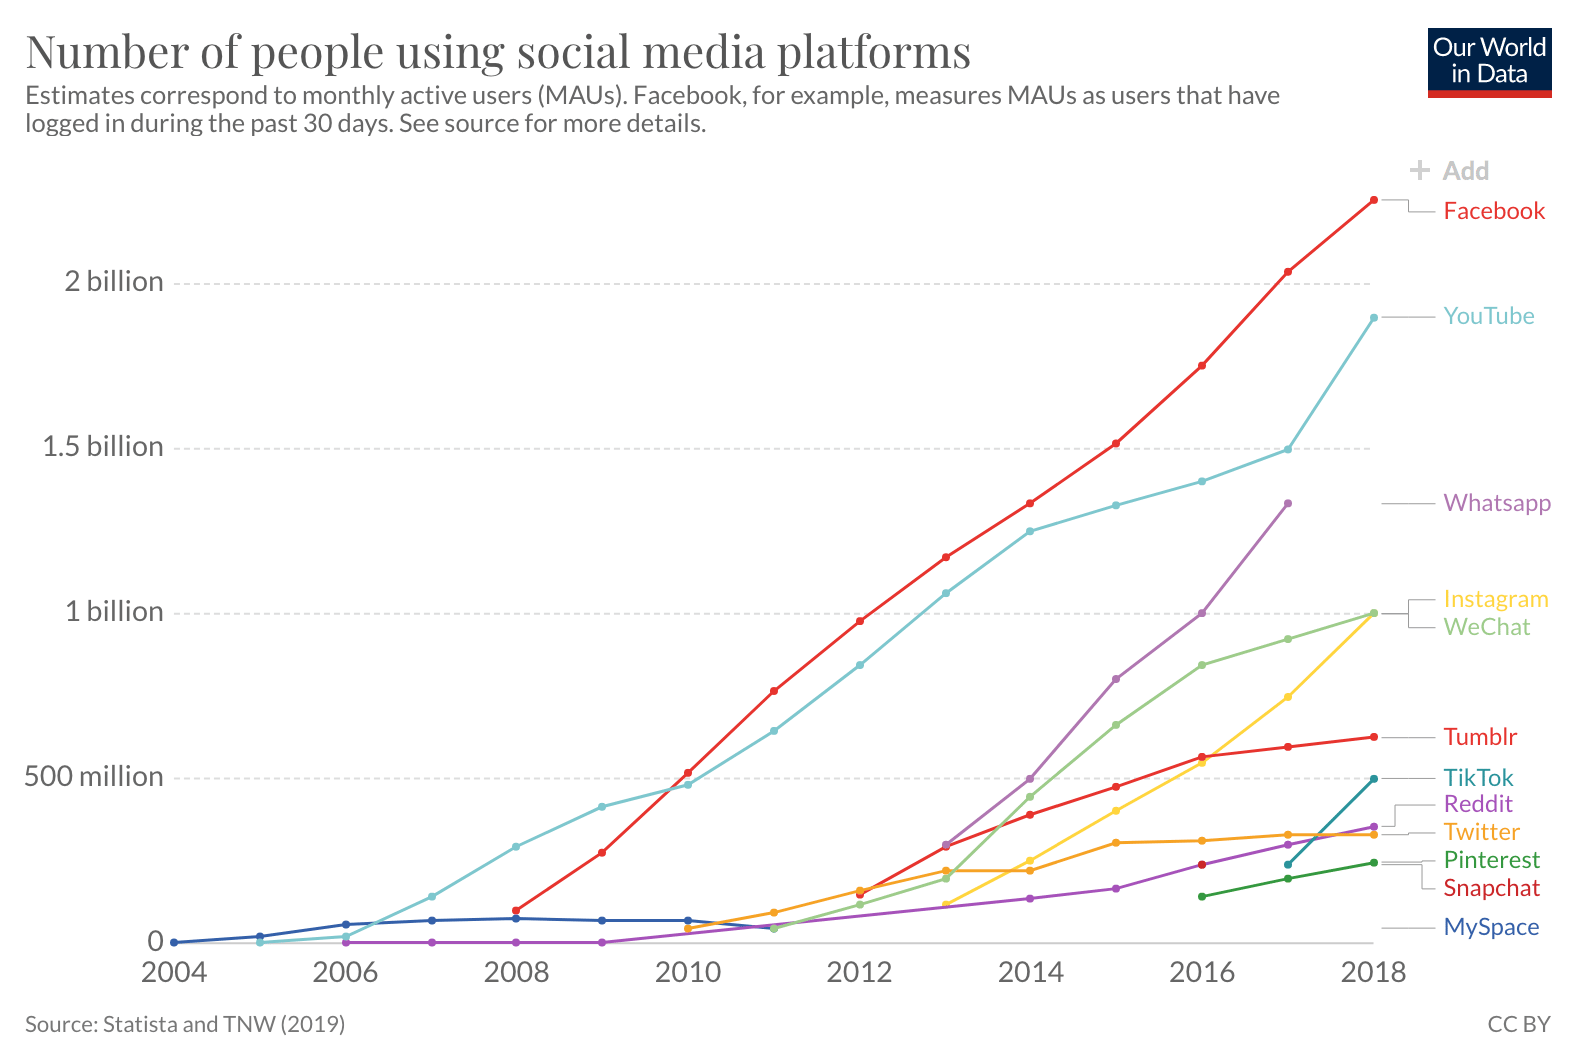
Image: Our World in Data
Because of this, you want to be aware of market trends and social channels that can help you drive new leads and increase revenue.
- According to the Global Digital Report, over 80% of internet users are on social media platforms.
- A 2019 report by eMarketer has revealed 90.4% of social media users in the US are millennials.
- Over 54% of social media users conduct product research on social media.
- Over 91% of social media traffic comes from mobile devices, while 95% of social media ads are viewed through mobile phones, according to Lyfe Marketing.
- A 2019 report by Sprout Social shows 77% of social media users are more likely to buy from brands they follow online.
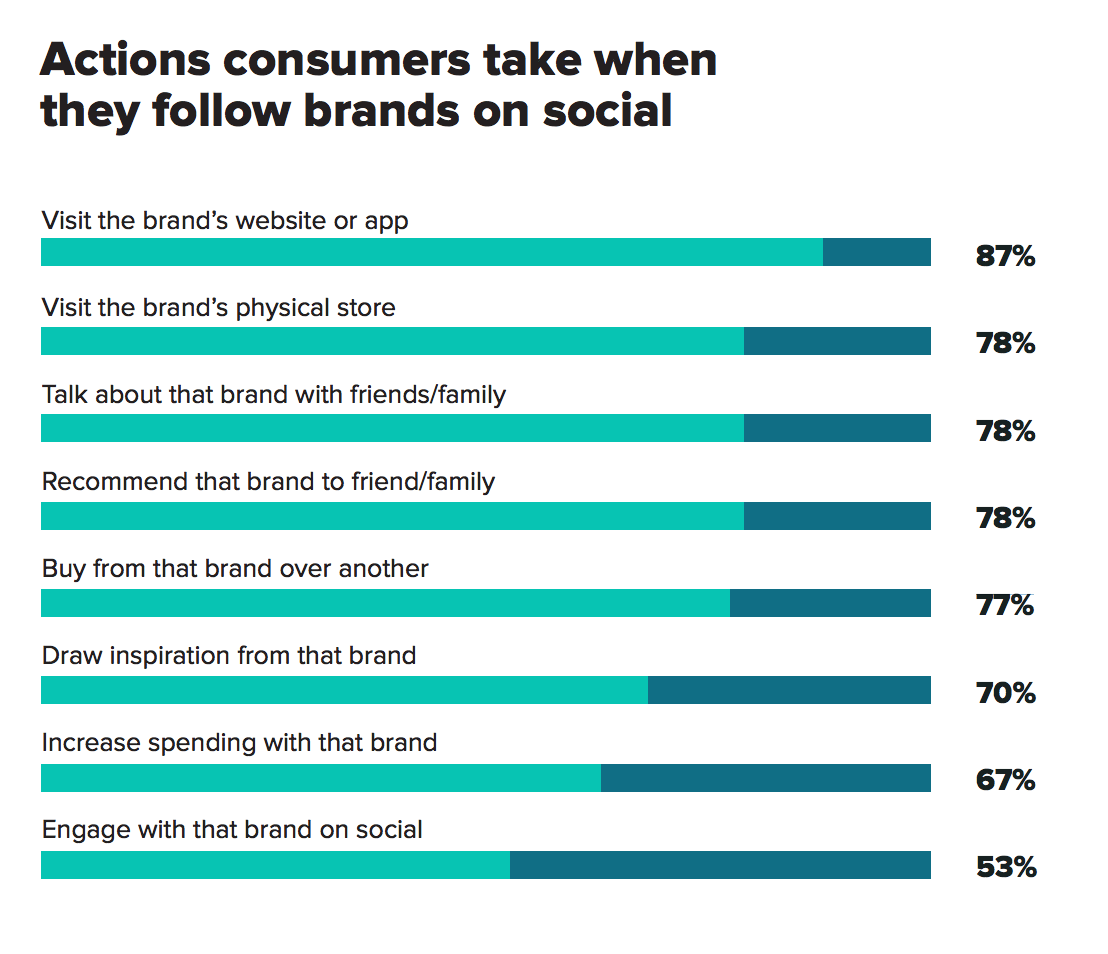
Image: Sprout Social
- The same source revealed 50% of consumers follow brands online to be in the loop with new product and service launch updates.
- Hootsuite reported that 90% of businesses use social media to improve their brand awareness.
- A Beyond the News Feed report revealed that social media growth is 15 times faster than other feed-based posts.
- About three in ten U.S. adults say they are “almost constantly” online.
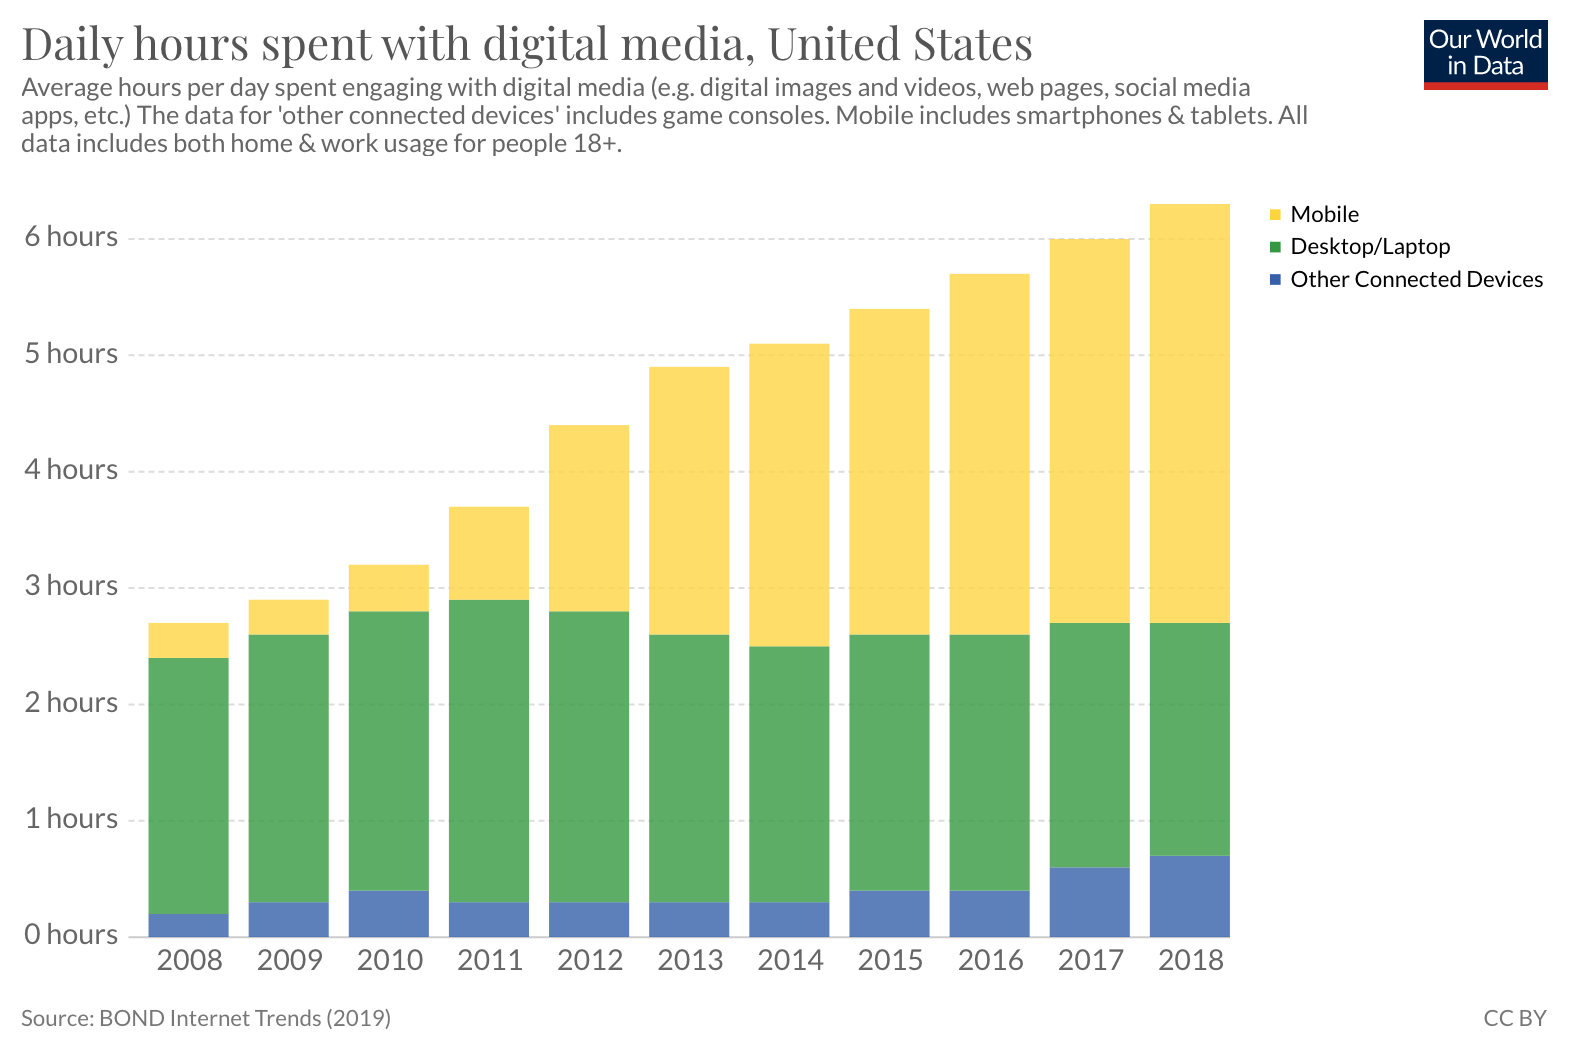
Image: Pew Research
Facebook Marketing Statistics
Facebook is the largest social media platform, with over 2.4 billion users. The platform has everything a business needs to reach new audiences. From sparking meaningful conversations to live streaming and running Facebook Ads, you can use Facebook to grow brand awareness, convert visitors, and run marketing campaigns.
- The current total of monthly active Facebook users has reached 2.41 billion, an increase of over 8% since 2018.
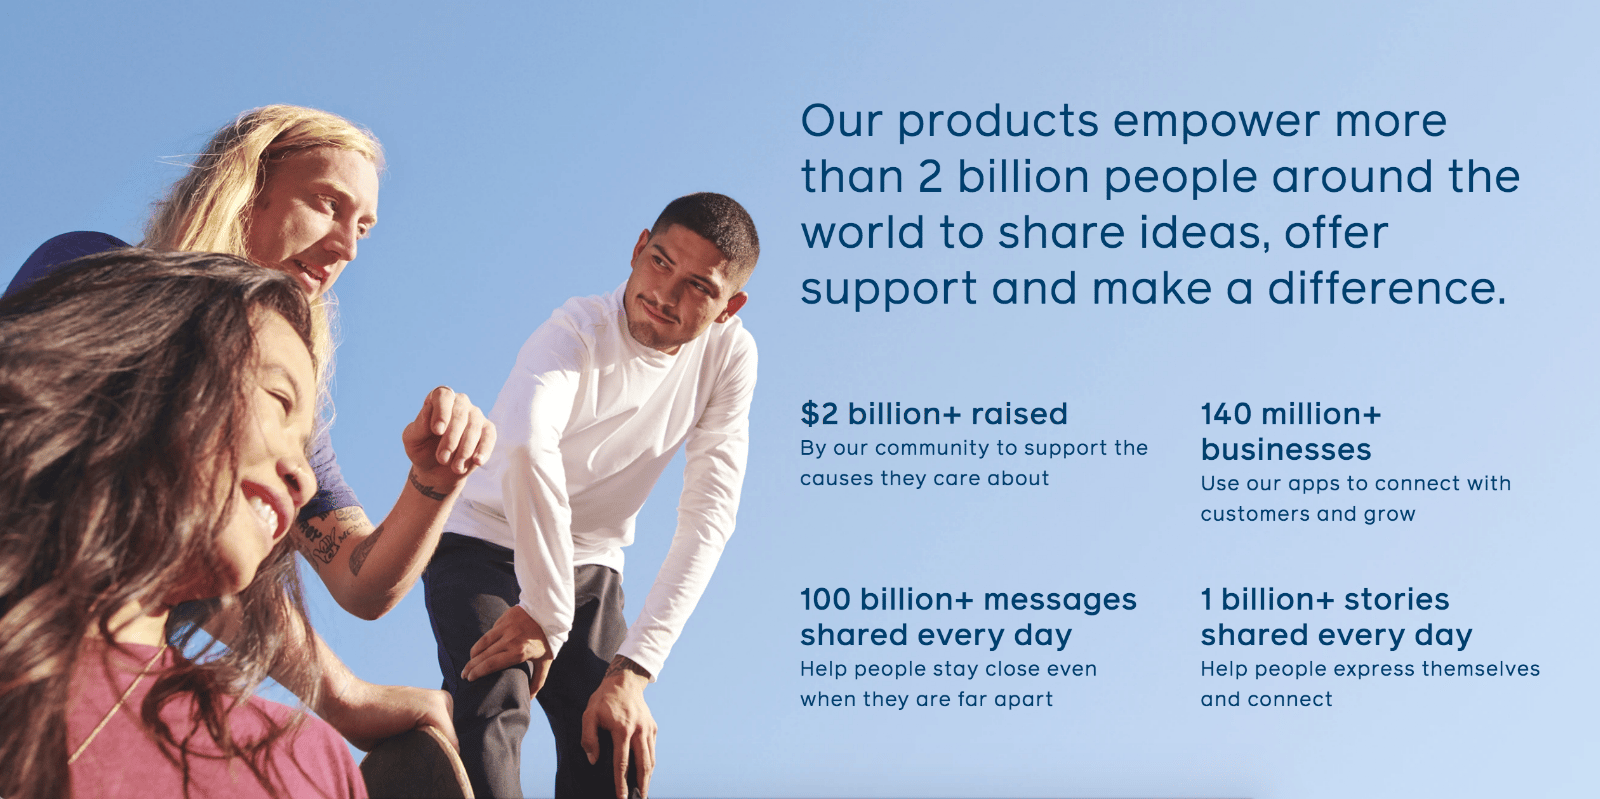
Image: Facebook News Room
- There are over 2 million monthly active advertisers on Facebook stories, as of January 2019. Over 71% of adults in the U.S. use Facebook. It’s the most prevalent social media marketing channel.
- According to an eMarketer report, only 40.5% of users between the ages of 12 and 17 use Facebook.
- There will be an estimated 7% increase in Facebook users who are 65 years and above, according to eMarketer.
- While 74% of Facebook users log in to their account daily, over 51% of users log in multiple times a day.
- In 2019, over 52% of adults in America got news through Facebook — compared to 48% in 2018 — while 15% of the US population shop on the social media platform.
- Over 1.4 billion users have joined Facebook groups, and over 300 million users put up Facebook stories daily.
- On average, a Facebook user likes 13 posts, shares one post, and makes five comments in a month.
- In 2020, 87.1% of U.S. marketers will use Facebook Marketing.
- In Q2, the average price per ad decreased 4% and the number of ad impressions served across Facebook increased by 33%.
Instagram Statistics
Instagram has become a powerful marketing tool since Facebook acquired it back in 2012. The media sharing site continues to roll out new features like Stories and live streaming that lets people engage with businesses in new ways.
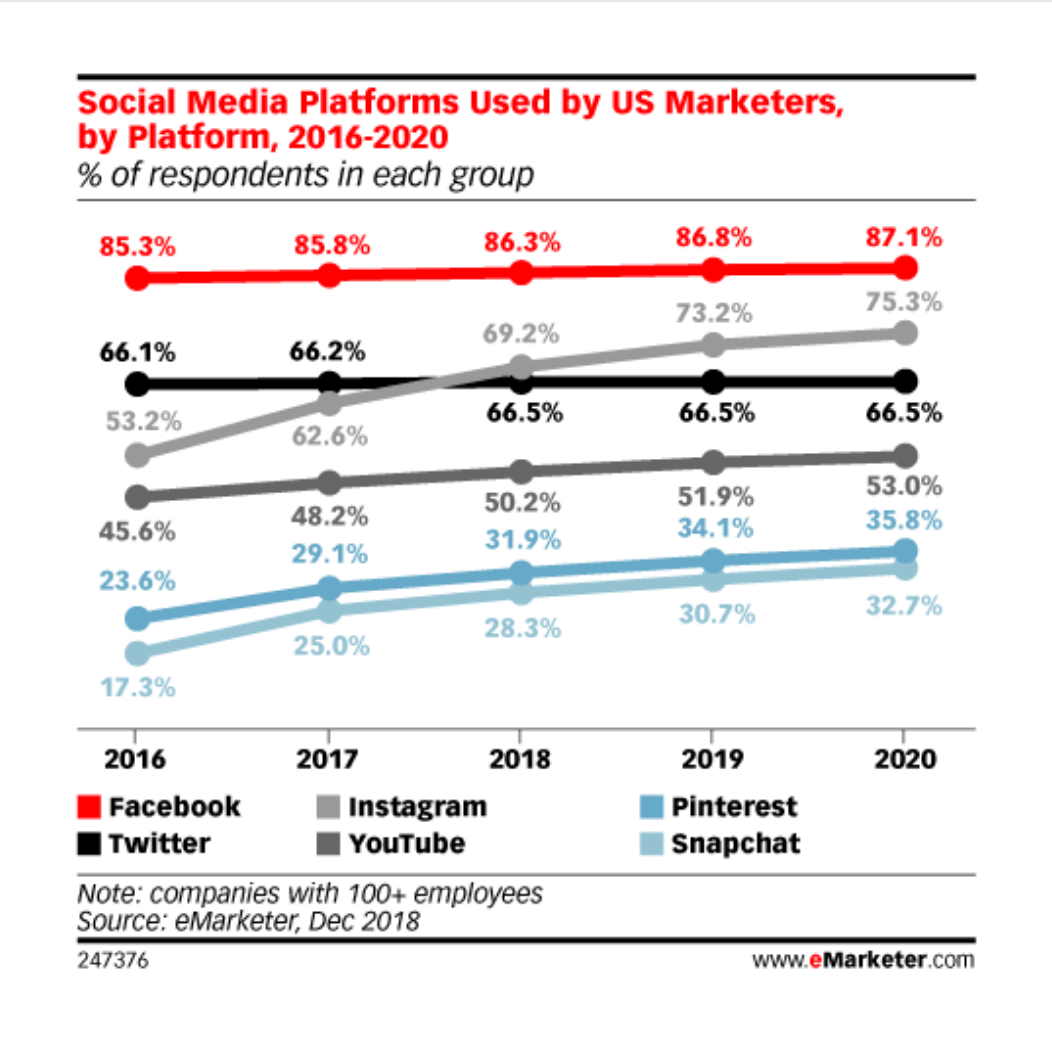
Image: eMarketer
- Instagram’s potential advertising reach is 849.3 million users, a 5.9% quarter-over-quarter increase.
- On average, brands put out 2.5 stories per week while 60% of brands use interactive elements like GIF, question, poll, @mention, or location on their story.
- The average brand story completion rate is 85%.
- U.S. marketers spend around 30% of their ad budget on Instagram stories.
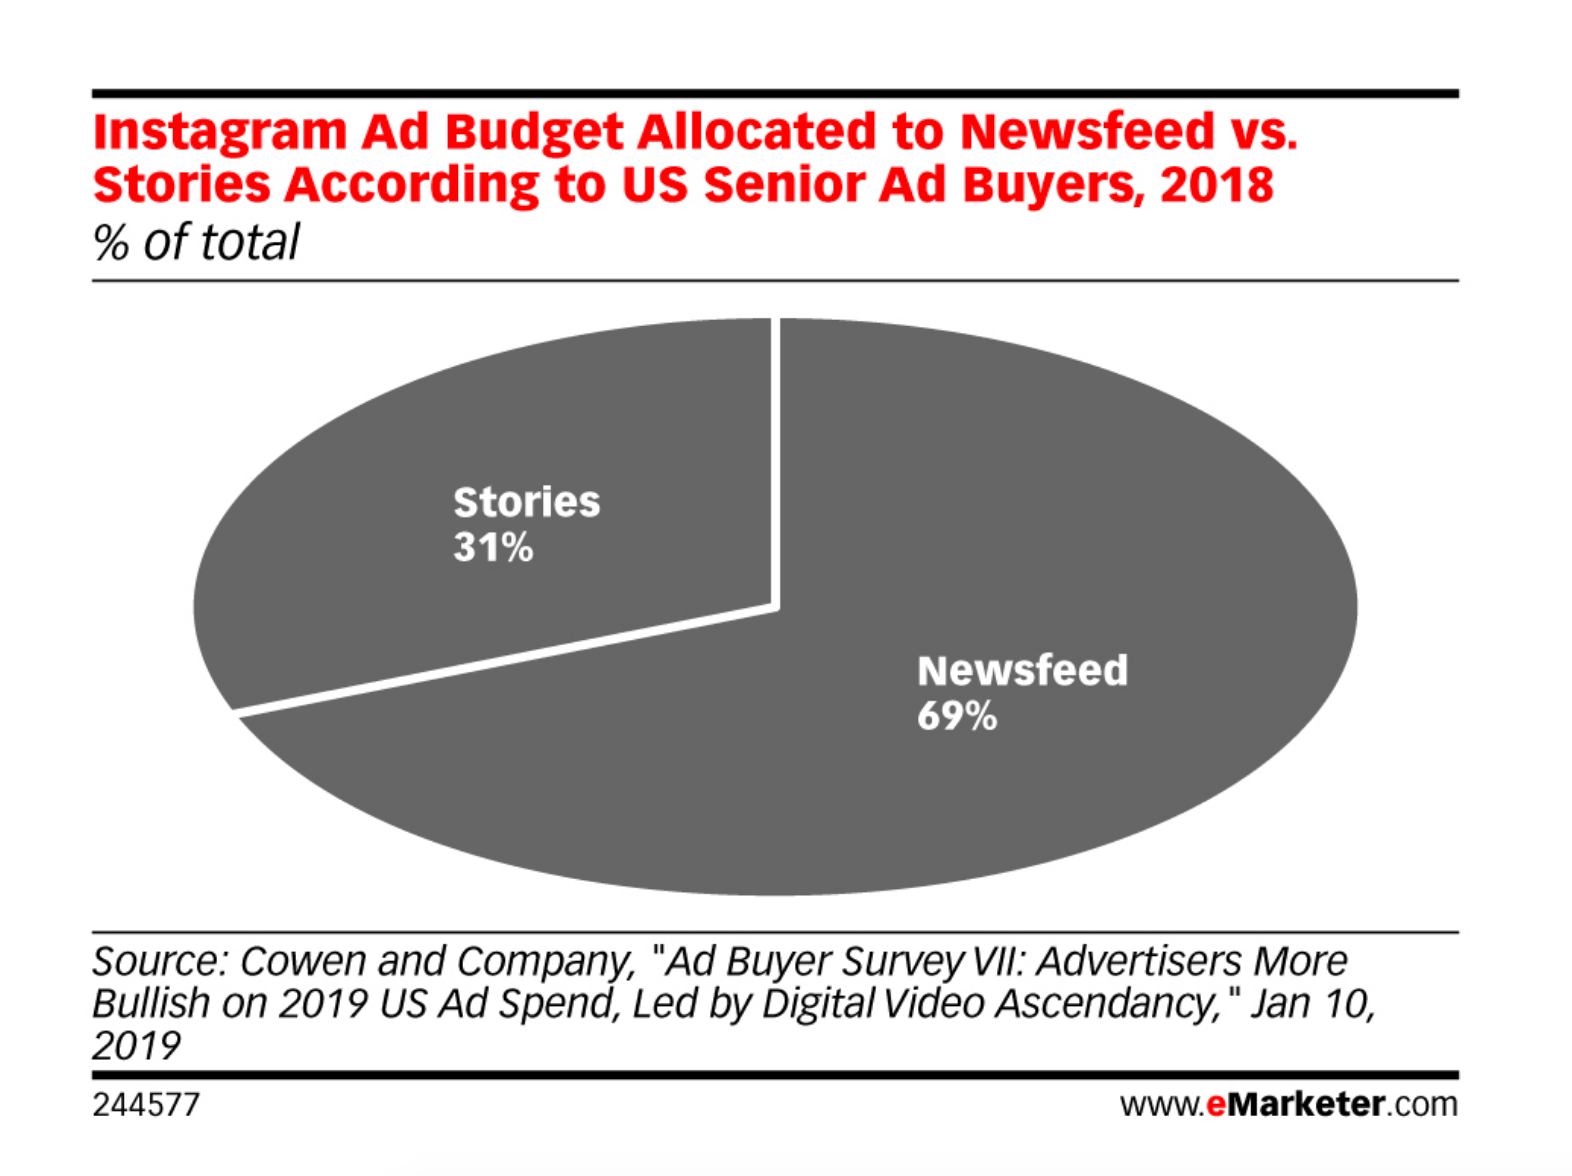
Image: eMarketer
- Half of Instagram users use the Explore tab to look for new content and accounts every month.
- On average, over 130 million Instagram users click on shopping posts every month.
- By 2020 the average Instagram user will spend 28 minutes on the platform every day, according to eMarketer.
- The average engagement rate on Instagram is between two and seven percent, compared to Facebook’s 0.10 to 1.5%.
Want to crush your Facebook and Instagram marketing goals this year? Get a free Manychat account today.
Twitter Statistics
Twitter is a good way to share your voice with the internet. The social media platform has taken strides to increase monetization and advertising capabilities over the years, making it an effective way to reach new audiences.
- Twitter has seen a 17% increase in monetizable active users since the Q3 of 2019, reaching over 145 million.
- According to a report by Pew Research, 74% of people use Twitter to get news.
- By 2020, Twitter’s user base is expected to increase by 0.3%.
- Twitter’s Q3 report revealed the network’s ad engagement rate is 23%. The same report showed that the Cost Per Engagement has gone down by 12%.
- U.S.-based Twitter users are younger, have more education, and more income than the general U.S. population, according to Pew Research Center.
- 20% of Twitter’s daily users are based in the U.S. according to the company’s Q3 Shareholder Report.
- Twitter ads with video are 50% cheaper for cost-per-engagement, saving you budget on ad spend.
- Tweets with hashtags get 100% more engagement, but only if one or two are used.
- Viewing photos and watching videos are the top reasons people use Twitter.
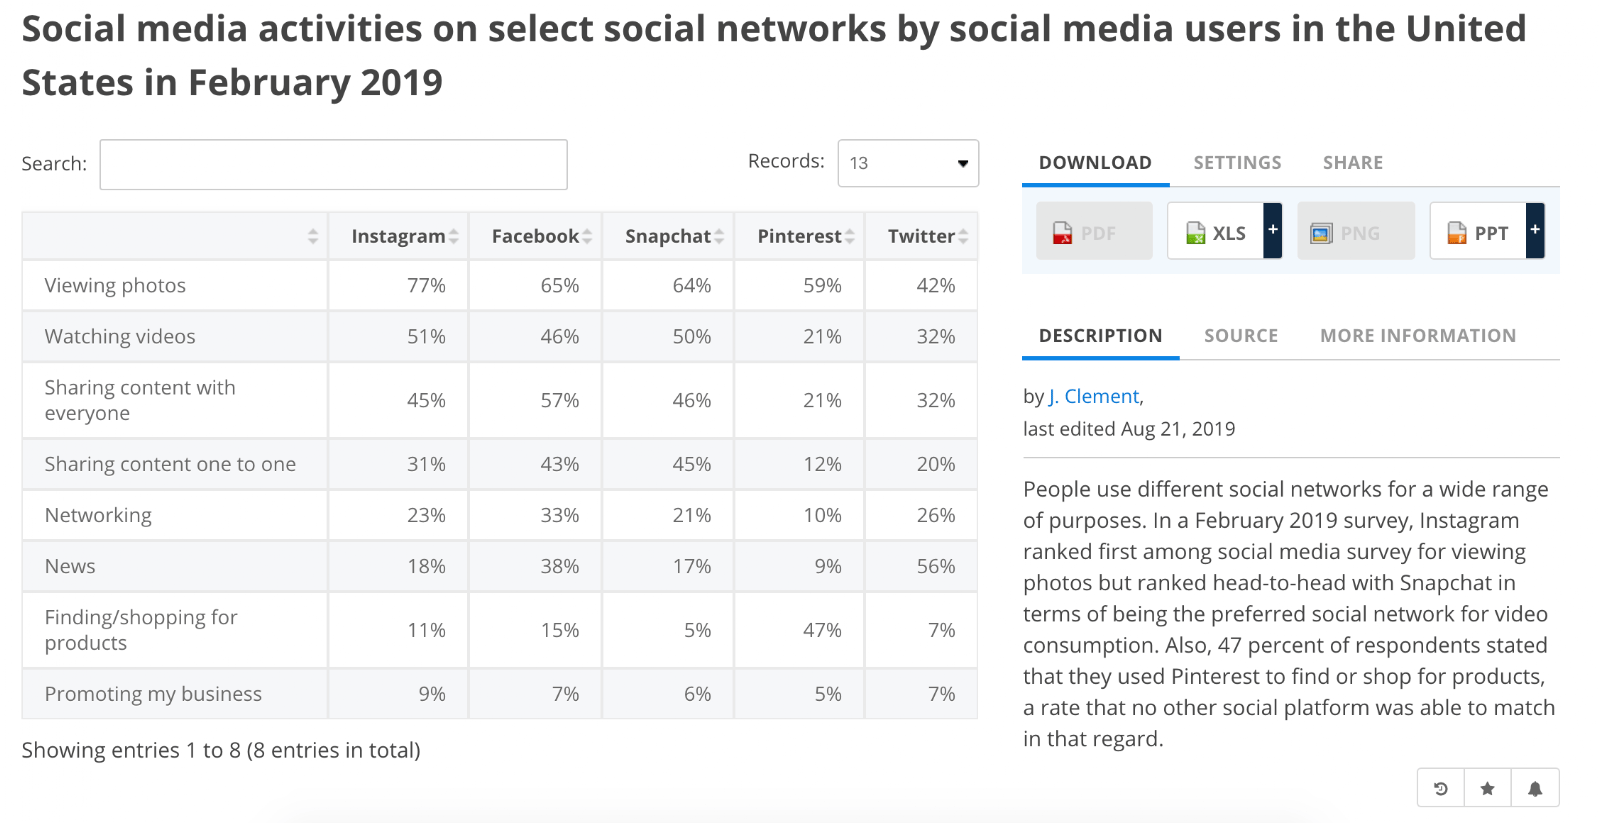
Image: Statista
LinkedIn Statistics
LinkedIn caters to a specific group of people: professionals. For many companies both B2B and B2C, it’s a great place to share thought leadership content and target a growing user base.
- With 2 professionals joining every second, LinkedIn has 660 million members worldwide.
- A report by the Pew Research Center shows that LinkedIn has more people in the age group of 25 to 49, and half of users have a college degree.
- A finding by Omnicore Agency has revealed that 40% of LinkedIn users visit the platform at least once every day.
- Linkedin has over 303 million monthly active users.
- 49% of LinkedIn users earn more than $75,000 per year.
- LinkedIn users spend around 17 minutes per month on the platform.
- LinkedIn is the number one channel for B2B marketers to distribute content.
- Posts that contain images get two times higher engagement. Video also receives five times more comments than regular posts.
- Only 57% of LinkedIn users access the platform through mobile devices. Compared to other networking sites, the percent is low.
- In the U.S. alone, three million companies use the platform to recruit new talent every month.
YouTube Statistics
With YouTube being the most viewed website in the world, social media marketers want to leverage this channel in anyway possible. Users flock to YouTube to watch all types of videos: funny, educational, inspiring.
- Over 1.9 billion people visit YouTube every month.
- YouTube works in 80 different languages and has local versions in 91 countries.
- YouTube is the most visited site in the world, according to Ahrefs.
- 70% of YouTube views are on mobile.
- 70% of millennial YouTube users watched a video to learn how to do something new last year.
- Over the last two years, the number of small- and medium-sized businesses advertising on YouTube has doubled.
- YouTube viewer ads receive viewer attention 83 percent of this time, according to Ipsos and Google advertising research.
Chat Marketing Statistics
Chat Marketing is here to stay. Most people would rather text than talk on the phone, and with the continual rise in messaging apps, people are using them to communicate even with businesses.
- The projected number of mobile phone messaging app users is projected to reach 3 billion by 2022.
- There are over 1.3 billion Facebook Messenger users, and 1.6 billion WhatsApp users, as of July 2019.
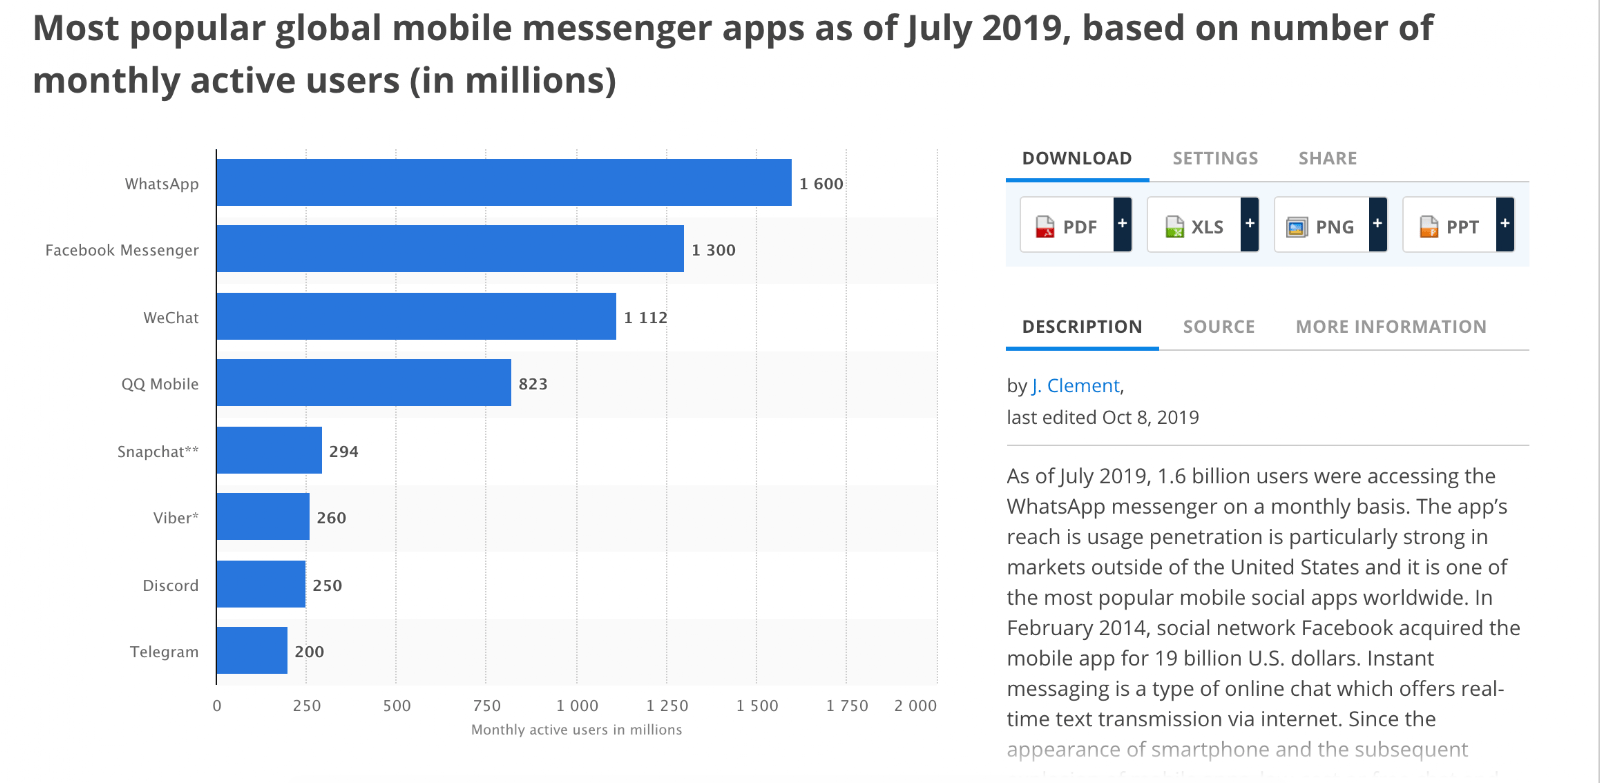
Image: Statista
- Group chat and sending emojis or media are the top two messaging features used by adults in the U.S.
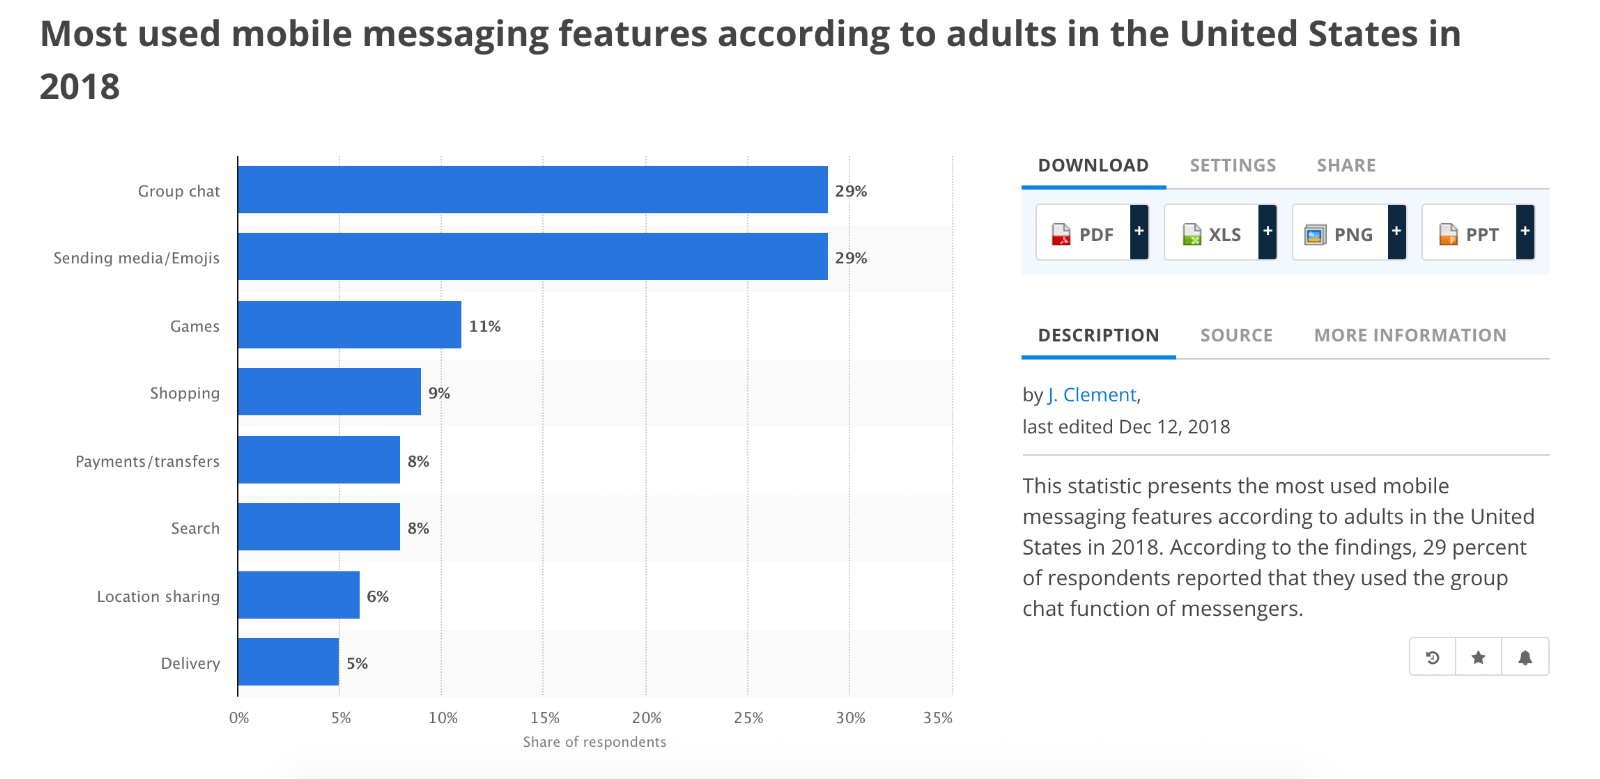
Image: Statista
- 47% of people say they use Facebook Messenger daily.
- Facebook Messenger users send 8 billion messages a day.
- There are over 300,000 active chatbots on Facebook Messenger.
- The average American checks their mobile phone 52 times per day.
- Gartner reports that the text message open rate is 98%, higher than email messages.
- On average, 90% of text messages are opened in 3 minutes.
- Consumers redeem SMS-delivered coupons 10 times more than other types of coupons.
- According to a market report, 48.7 million people will opt-in for promotional text marketing services by 2020.
- By 2021, live customer chat is predicted to increase by 87%.
- While 92% of the US population has a text-enabled phone, only 14% of businesses use text marketing.
- 71% of customers find text messaging effective for communicating with brands.
- Approximately 70% of all consumers are using chatbots more or the same over the course of the past year.
Grow your social media marketing faster with Manychat. In one dashboard, you can run ads and create conversations with potential customers across the multiple channels you already use. Try it free today.

Originally published: Nov 28, 2019