Product Update: Manychat Analytics, Conversion Tracking, and the Manychat Pixel

While having “many chats” with Conversations 2019 attendees, we learned our community wanted an easier way to understand performance differences between campaigns and individual flows. So we set out to build a system that would highlight key information like revenue generated, contact data collected, and overall interaction rates.
Then we took it one step further – building out our own pixel so that you can connect those Manychat conversations to conversions on your website.
Let’s take a quick look at the different parts of Manychat Analytics which is available with your Manychat Pro subscription.
Conversion Types
Manychat Analytics supports five types of conversions at the moment. There are three that are automatic, and two that you can customize to fit your needs.
Buy Button Conversions
Manychat Analytics will automatically identify in-Messenger purchases through a buy button as a conversion — logging the total cart value as “earned” revenue for the flow where the purchase happened. Use this conversion type to determine which flows are bringing you the most revenue from purchases inside of Messenger.
Example of creating a buy button in Manychat.
Contact Collection Conversions
Any time you collect an email address or phone number as a system field, it will be counted as a conversion in your flow. Use this conversion type to find which flows are the best at helping you collect leads or build your contact list.
The best way to gather contact info is with a “User-Input” step. Make sure to toggle on the “system field” option and confirm your subscriber’s consent to receive messages on another channel.
Example of building a User-Input Step to collect phone numbers.
Shopify Conversions
If you use Manychat’s Shopify integration, we’ll automatically record revenue when someone clicks through on a flow that starts by using the “Shopify Abandoned Cart” trigger. This will help you quickly tally the revenue you rescue by combining Manychat with your Shopify store.
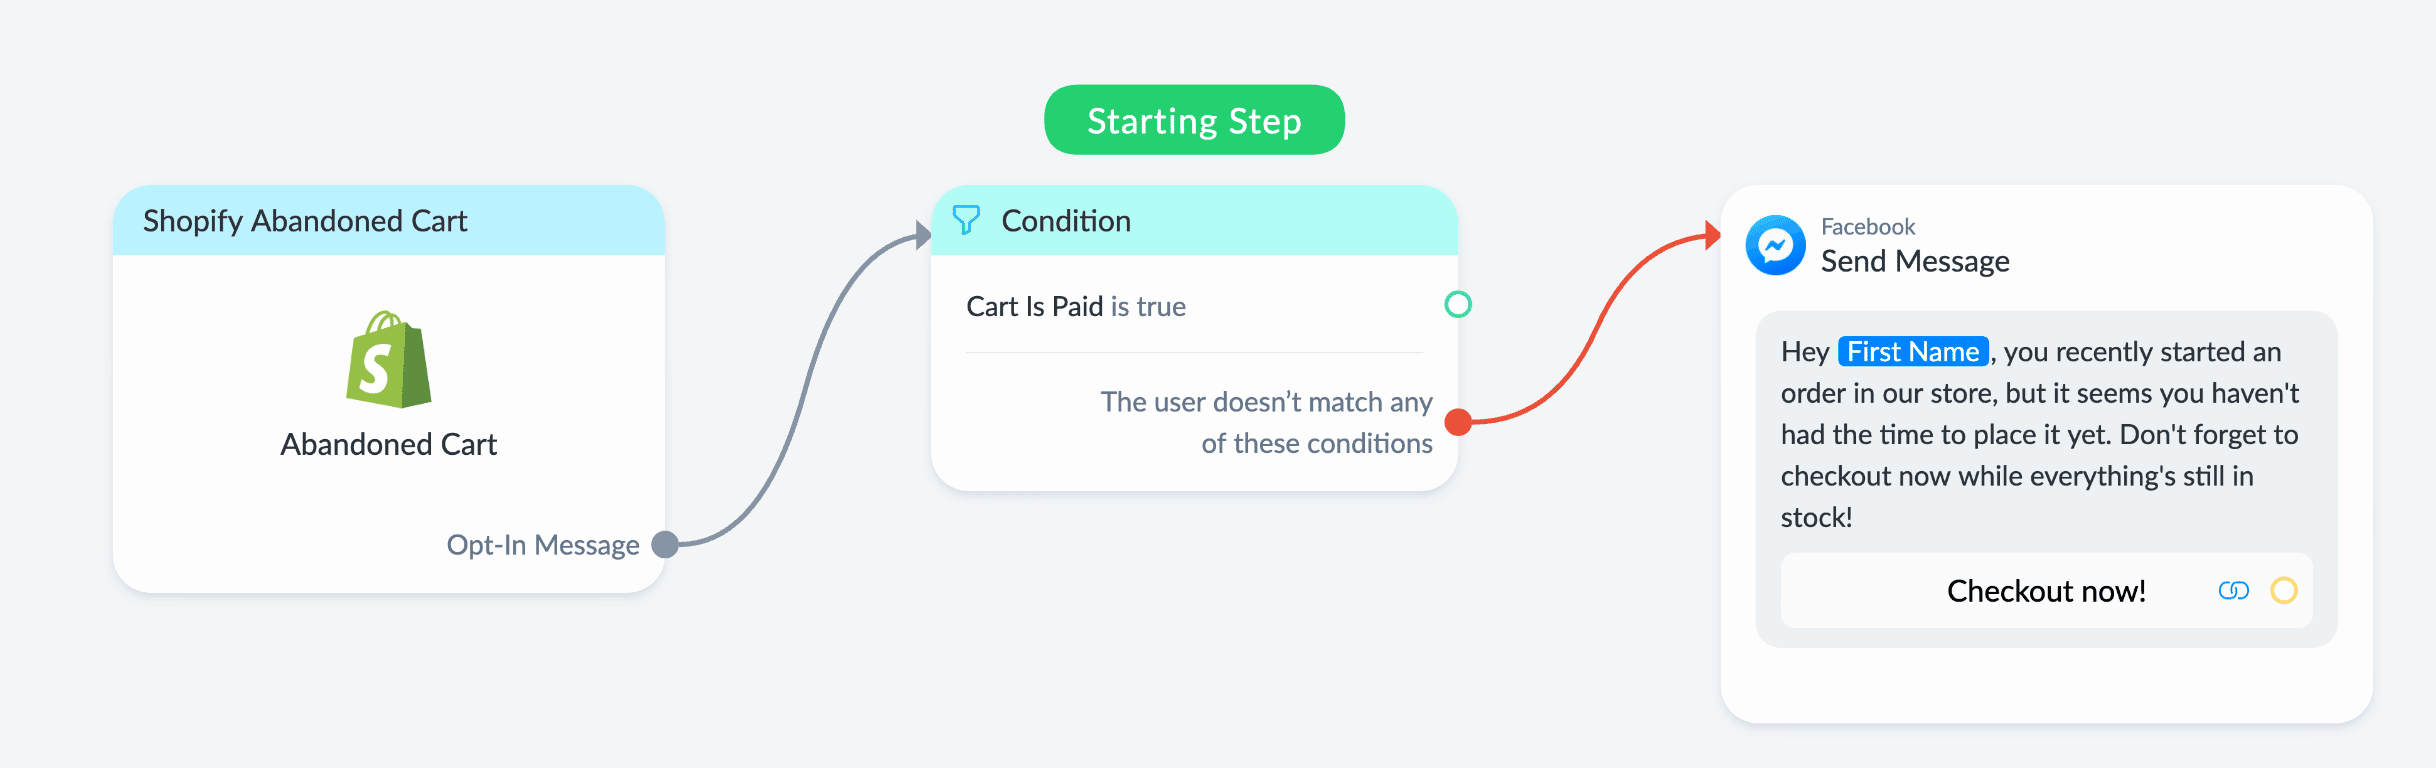
Example abandoned cart Shopify flow.
Action Step Conversions
Action Step Conversions are customizable conversions that you can insert anywhere an Action step would normally go. You can also assign a specific revenue value to any Action Step Conversion. This value will be attributed as “earned” revenue to the flow every time a conversion is recorded.
Creating a custom conversion using an Action Step.
Use Action step Conversions to record other key moments in your flows that you want to quickly compare. This is important for businesses that have more than one step in their conversion funnel.
For example, imagine you’re a gym that uses a 7-day challenge as a key tactic in getting people to join. While opting-in for your Messenger content doesn’t equal a sale, it’s still an important conversion moment on the way to becoming a customer. You would definitely want to test different flows and growth tools and compare which has the highest conversion rate for the 7-day challenge.
Pixel Conversions
With the Manychat Pixel, you can connect people who click through to your site from a button on Messenger to their actions on your website. When subscribers convert on your website, it will be recorded and attributed to the flow that they came from.
Pixel conversions are great if you are only able to sell your product or service on your own website. Now you can connect those conversions directly to the flow that prompted them. And remember, just like action steps, a Pixel conversion doesn’t have to be a sale. It could be filling out a lead form or viewing a certain page that indicates interest to convert in the future.
Get started by going to Automation → Pixel and grabbing your pixel code.
Manychat Pixel code
Installing the Manychat Pixel, like any tracking code, takes a little bit of effort. You can read up on how to do it here — it’s worth it!
How to View Analytics
Now that you’ve got your conversions set up, it’s time to take a look at what’s working and what isn’t. We’ve added some new items to existing dashboards as well as an entirely new metrics dashboard.
The Metrics Dashboard
A new tab called “Metrics” is now available in your dashboard on Manychat Pro. Just click the tab to see an overview of revenue and specific conversions across all of your flows.
The metrics blocks located above the charts display these key metrics that represent the health of your business in your selected currency:
- Earned shows the total revenue earned for the specified time period.
- ARPPU (Average Revenue Per Paying User) shows how much revenue you’ve made from a unique paying customer (we call them “buyers”) for a specified time period. Use it to compare your marketing expenses so you can understand if your strategy is leading to success.
- APC (Average Payment Count) shows your sales retention rate of a buyer by displaying the average number of purchases each unique buyer makes for the specified time period. For example, if your APC =1, this means that you’re averaging one purchase per unique buyer. A higher APC means that your buyers are making repeat purchases, indicating loyalty to your business.
- Sales show the total number of sales made for the specified time period.
- Buyers show the total number of unique buyers who have purchased a product for the specified time period.
If you’re a Shopify user who has connected their store to Manychat with our native integration, your Shopify metrics will be pulled directly from your store into the metrics dashboard automatically.
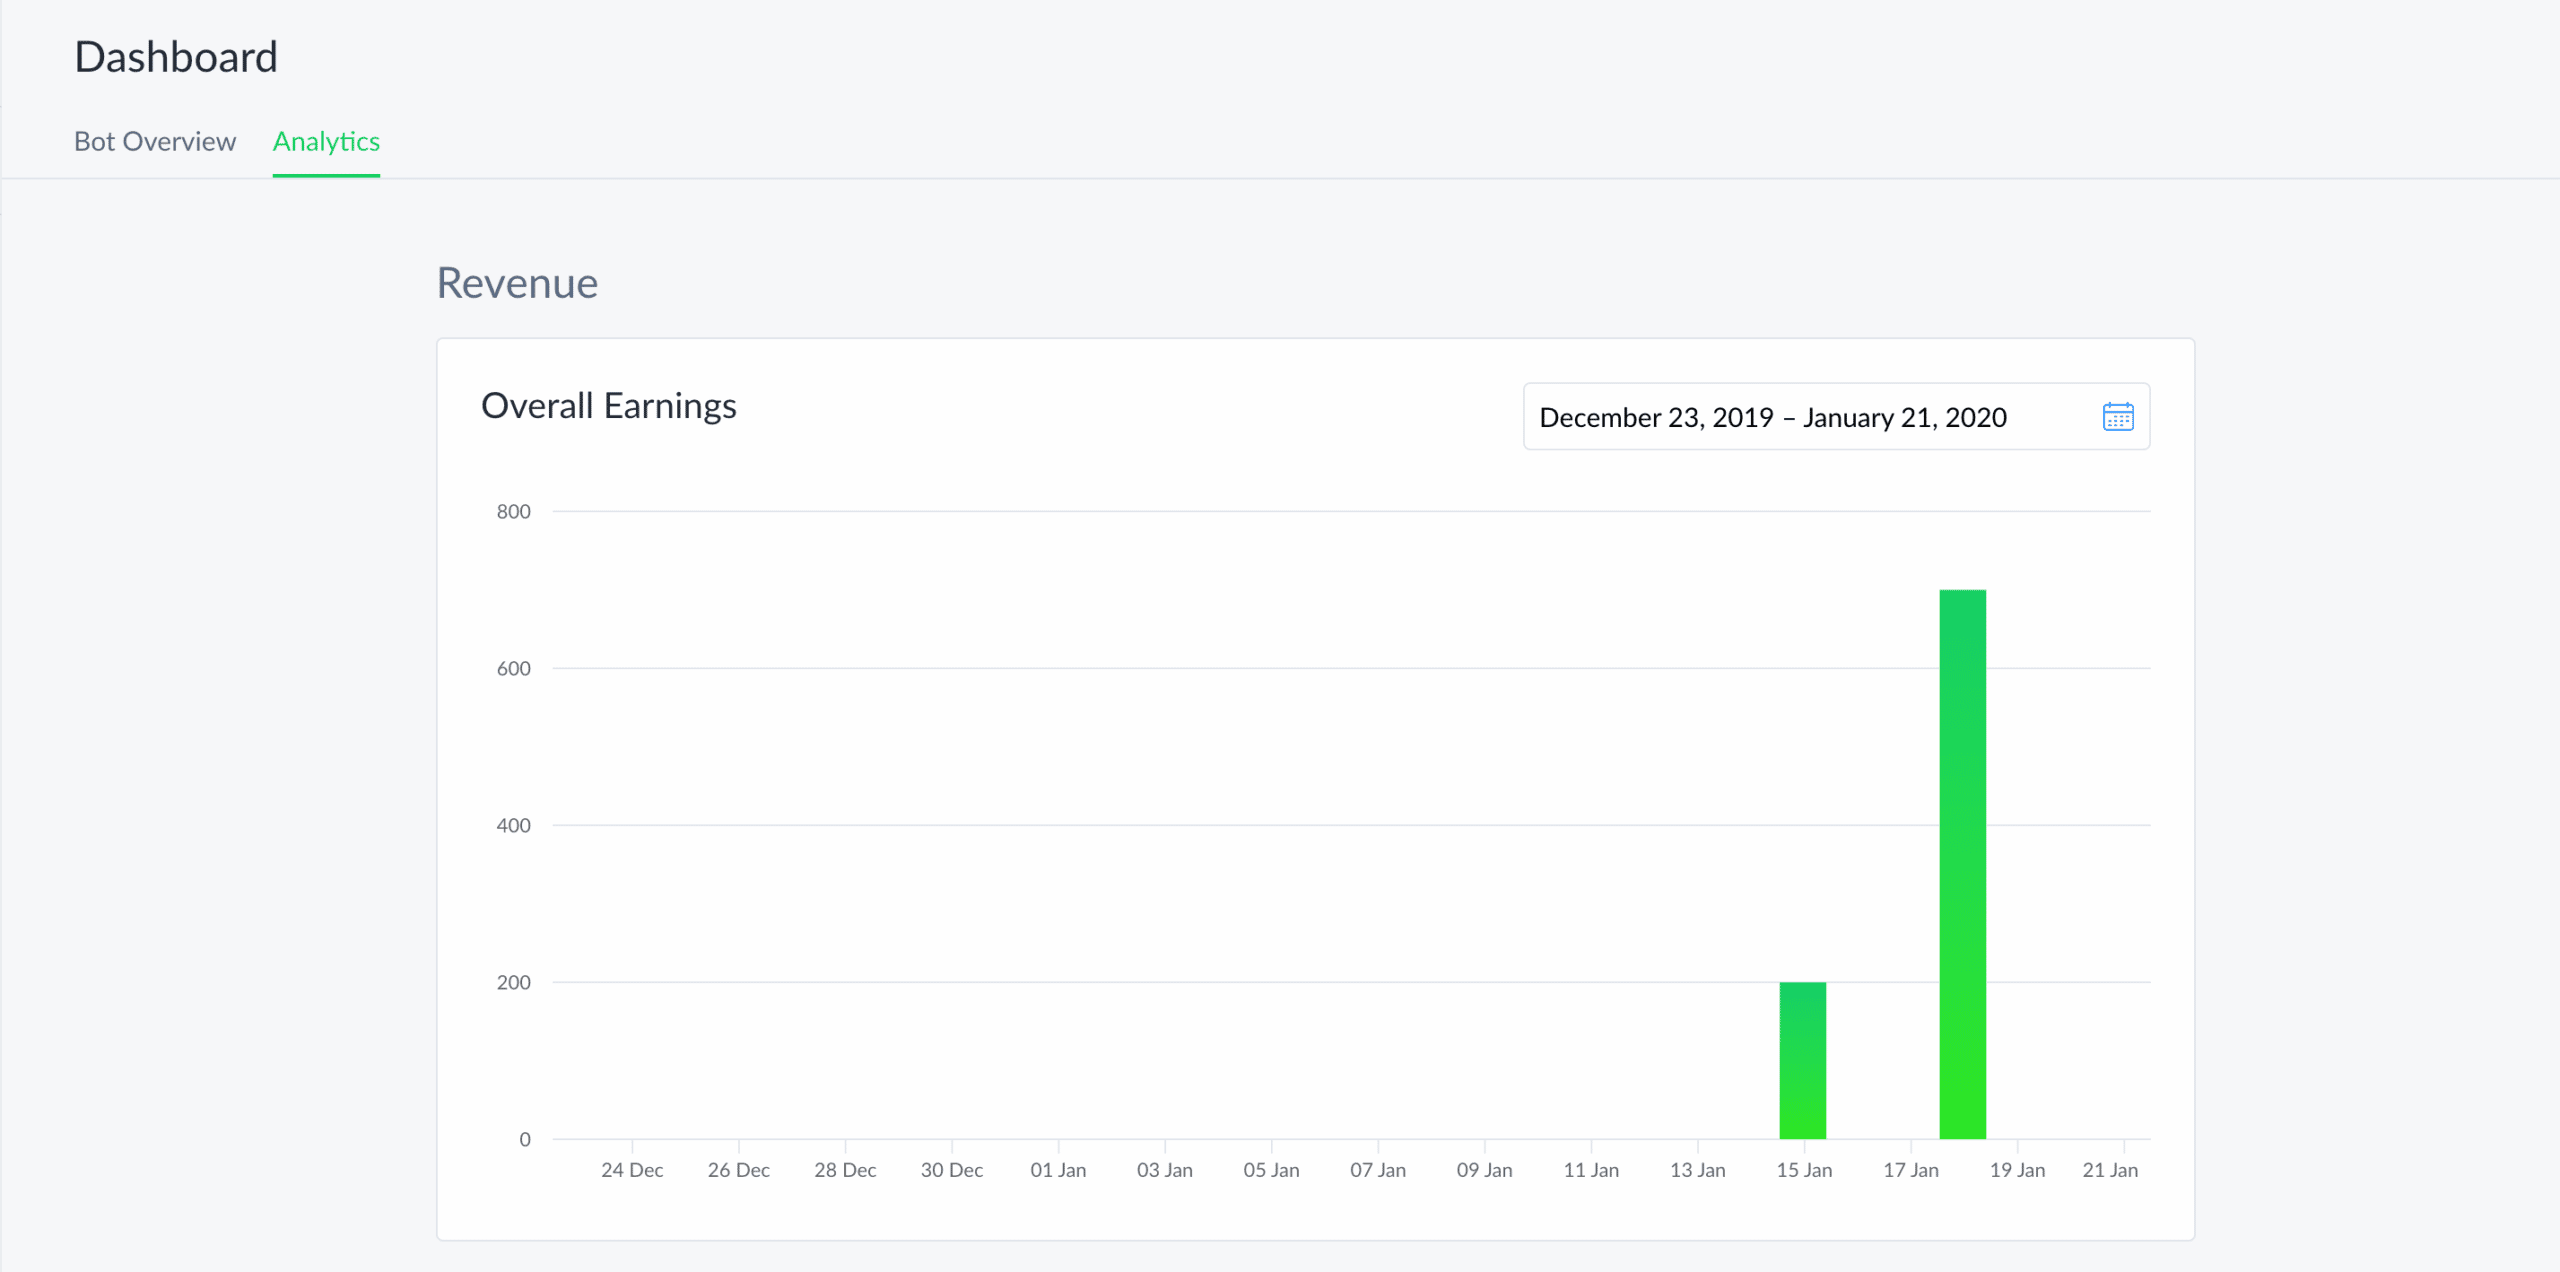
The revenue graph shows the total amount of revenue generated from each day, combined across all flows.
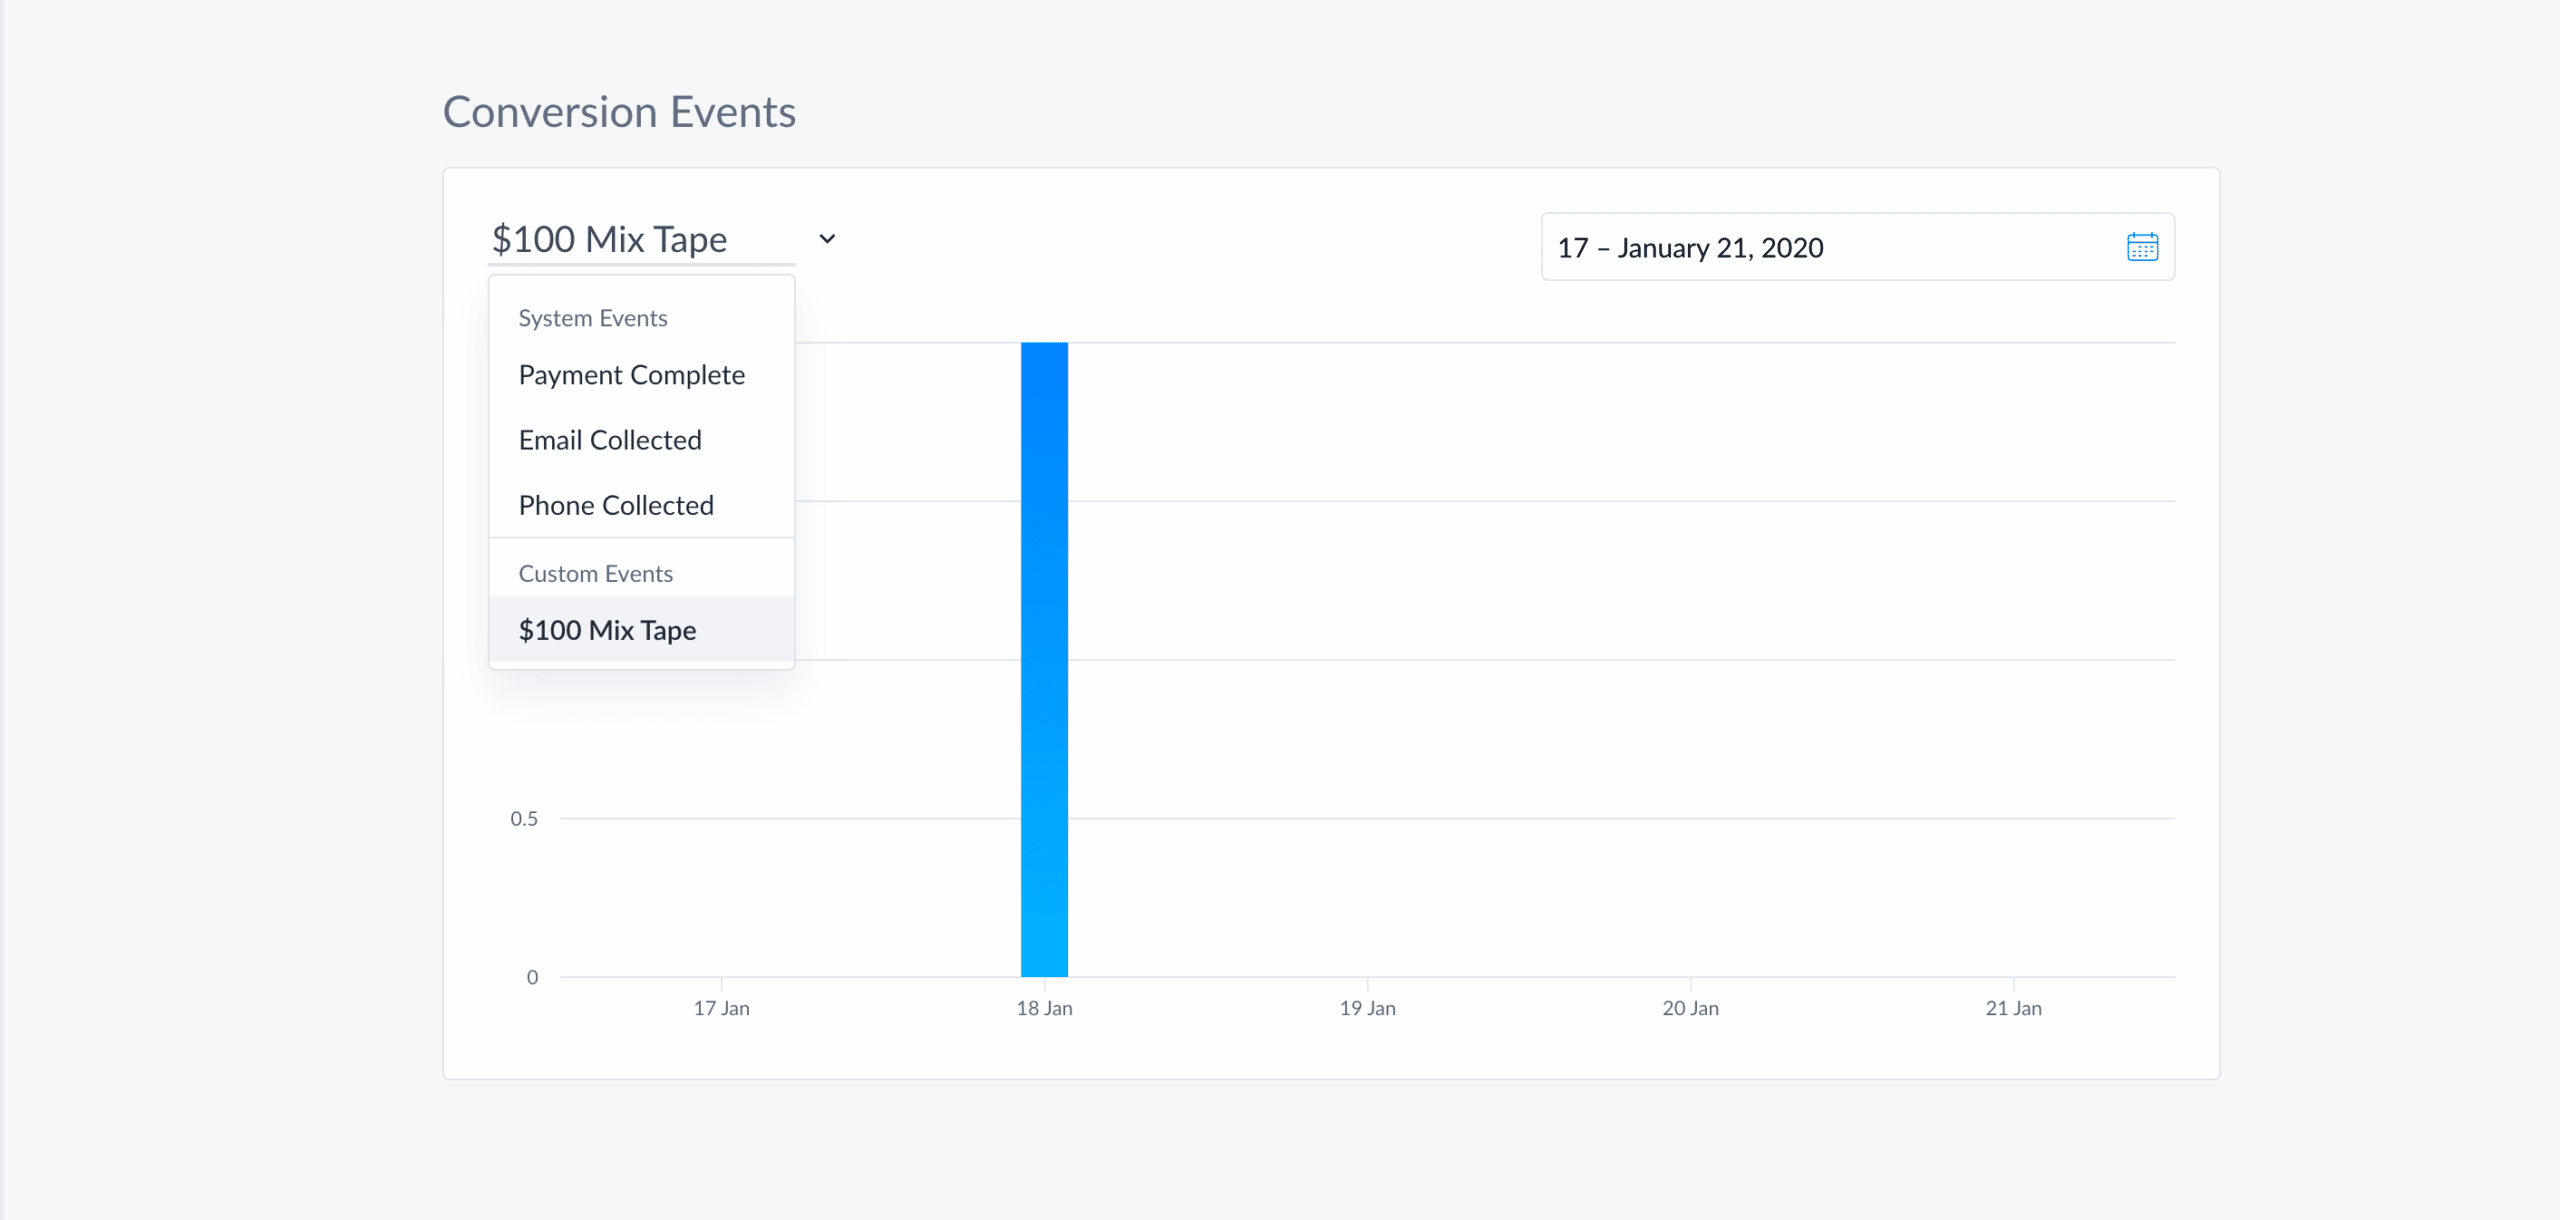
The Conversion Events Graph lets you explore specific individual conversions. This will help you figure out what is driving revenue and understand progress on non-revenue goals like contact collection or moving subscribers deeper into your sales funnel.
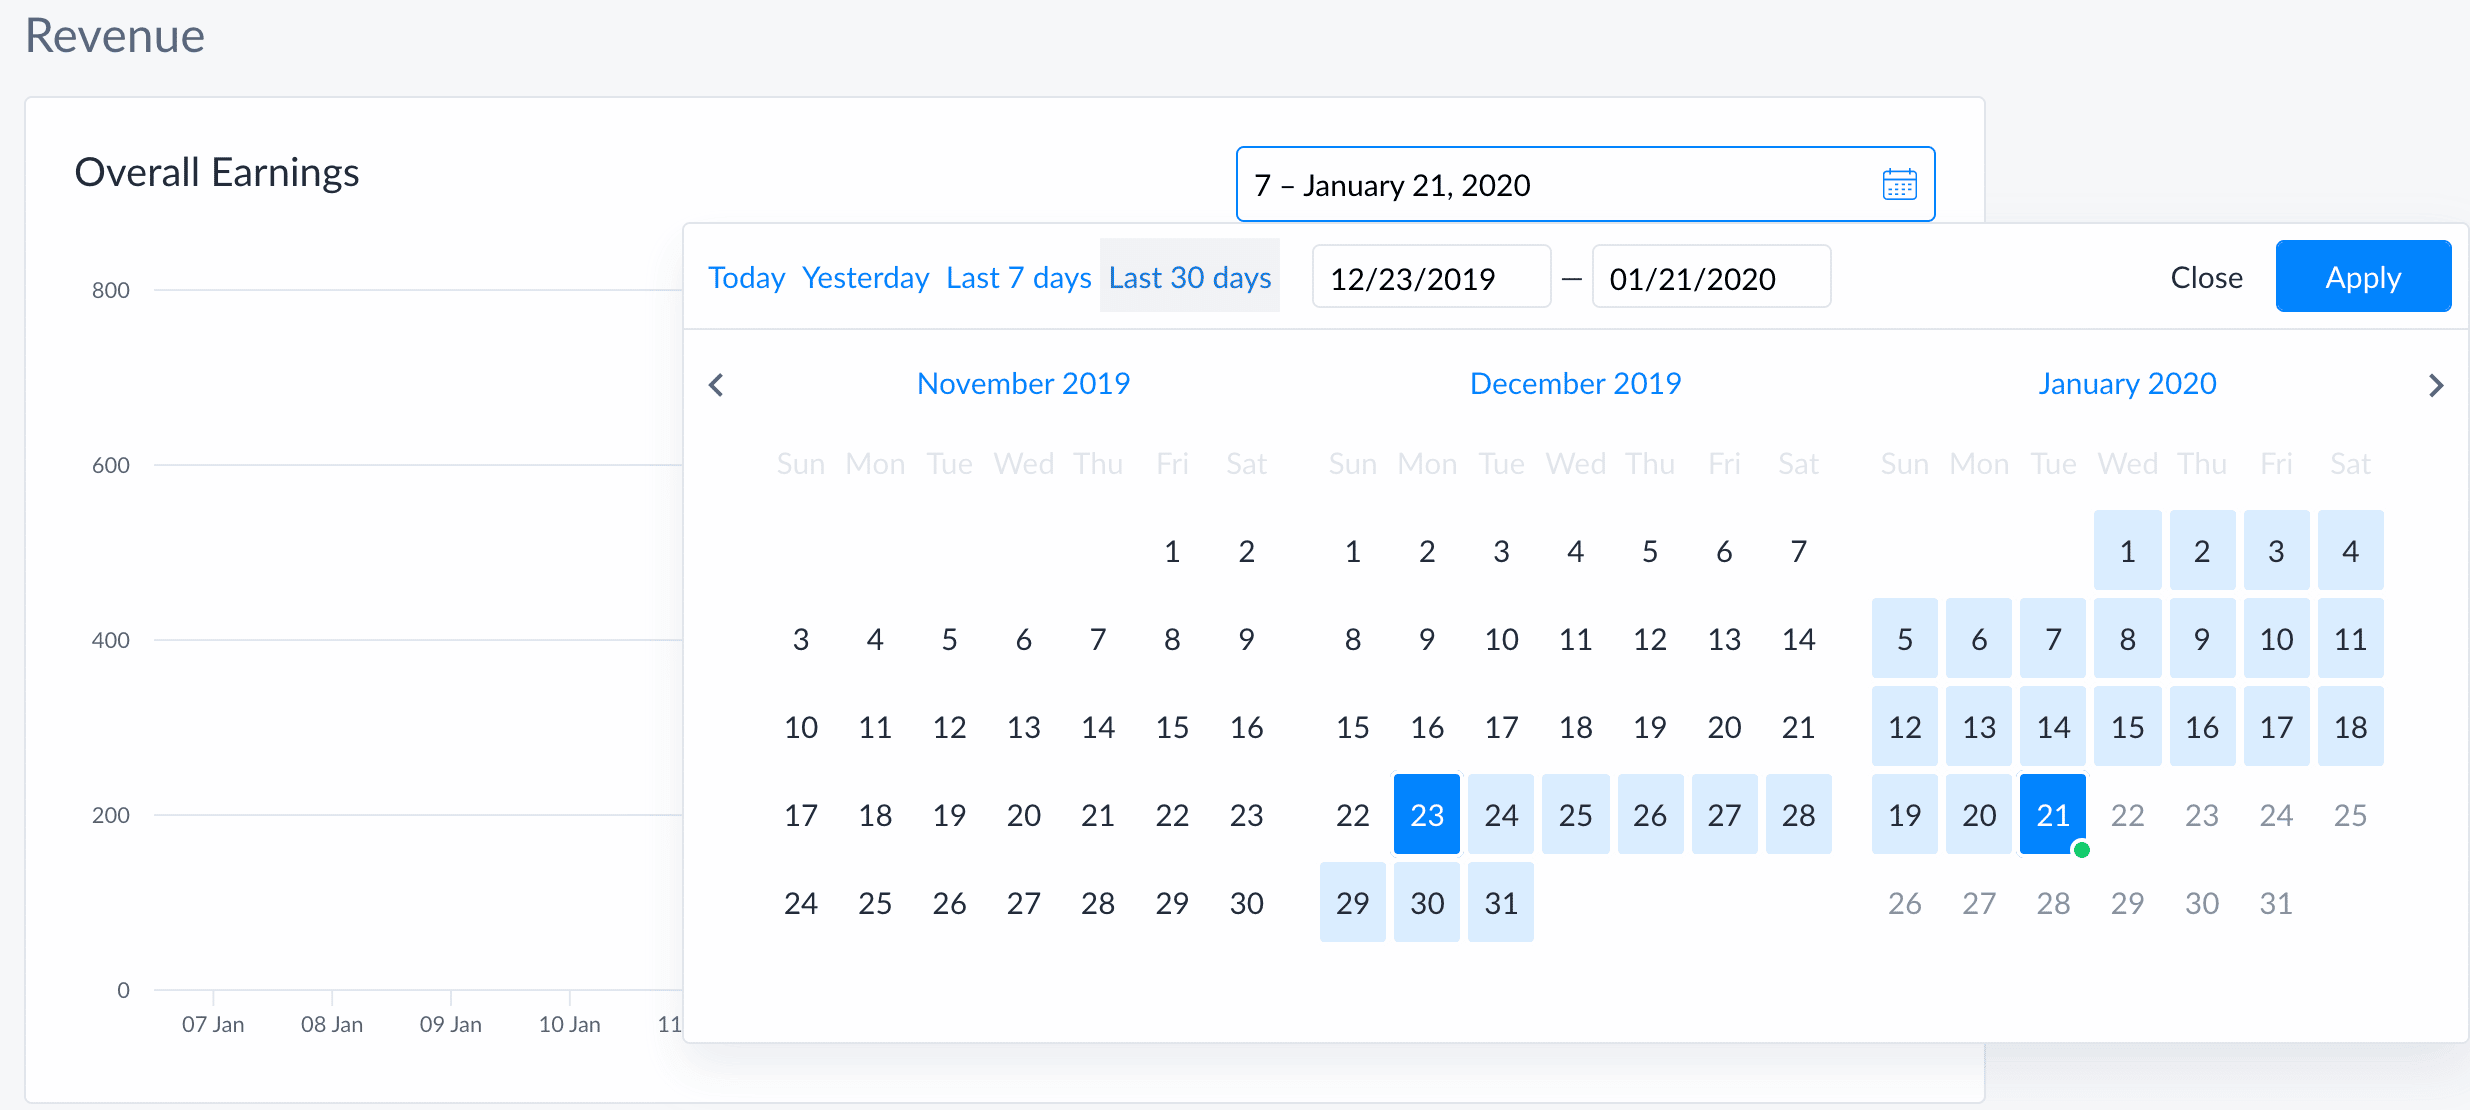
Both graphs can be configured for a specific period of time. This is really helpful to get an overview of results from a single campaign that ran for a month, week, or a couple of days.
We’ll be adding more options to this tab over time.
Highest Revenue Flows
We’ve also added a new section to the Bot Overview tab on your dashboard to display your highest grossing flows. It will automatically show the flows that are earning the most revenue for your business.
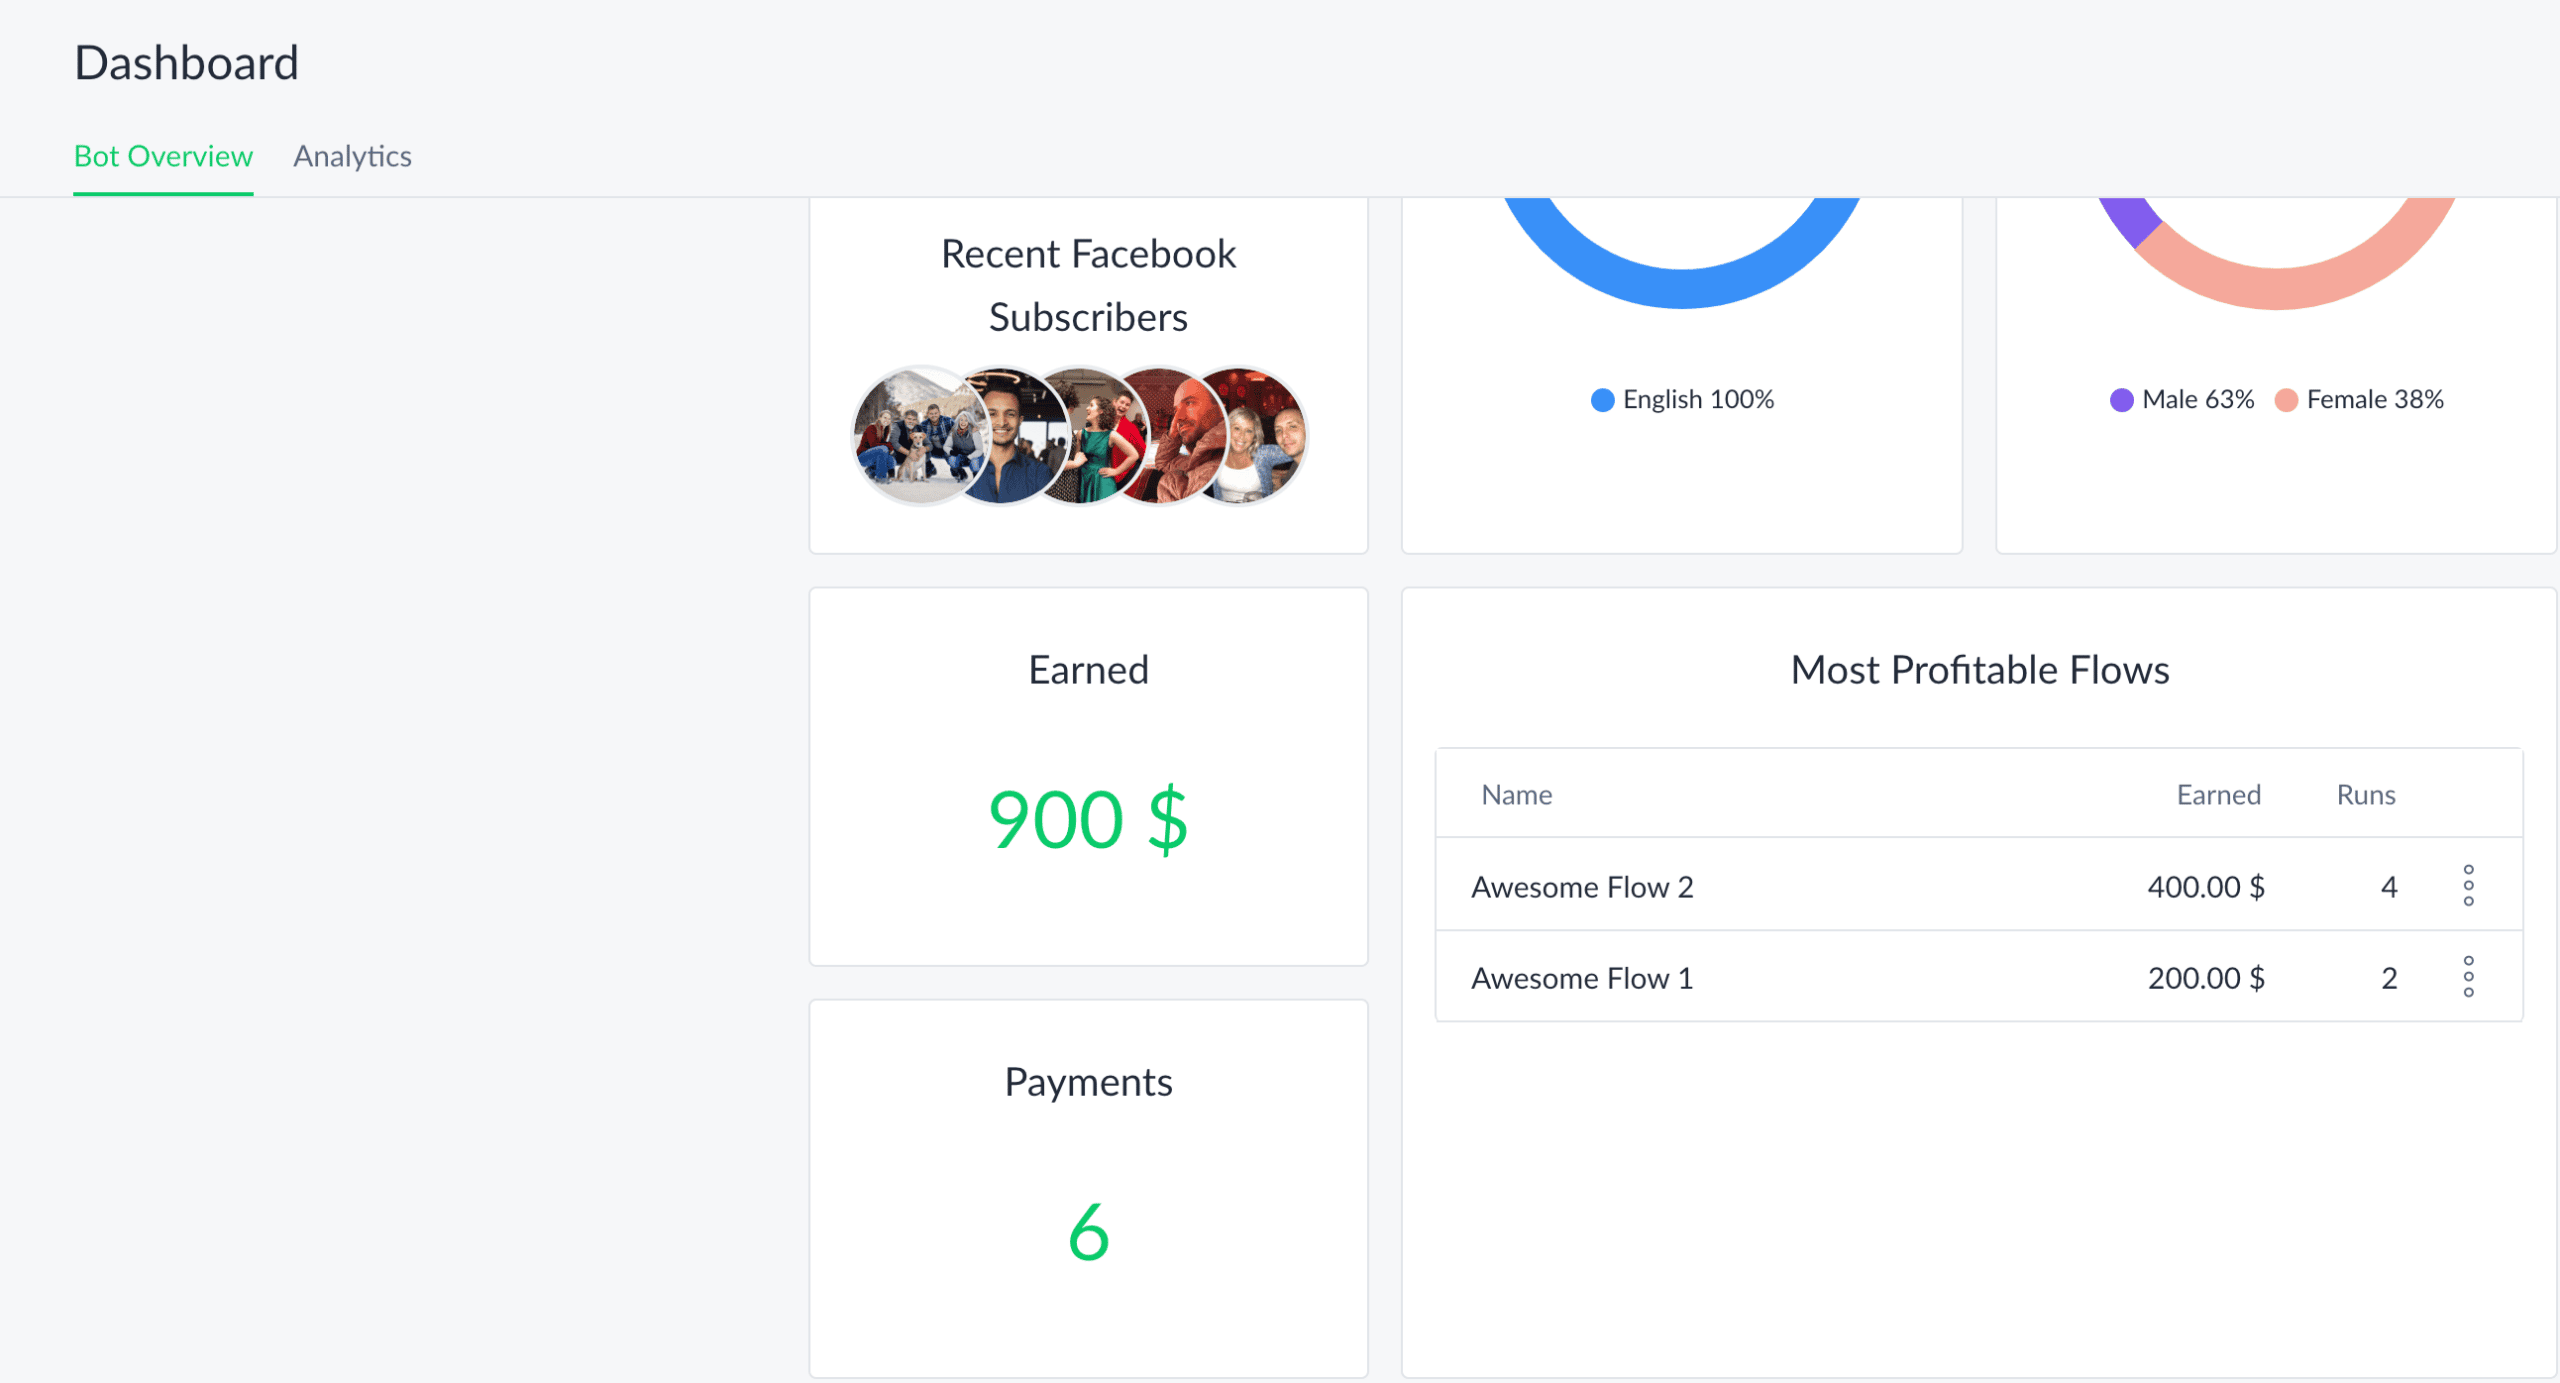
Right next to the “Most Profitable Flows” section will be the cumulative total revenue earned to date (“Earned” above) and the total number of conversion events that contributed to that revenue (“Payments” above).
Flow Specific Analytics
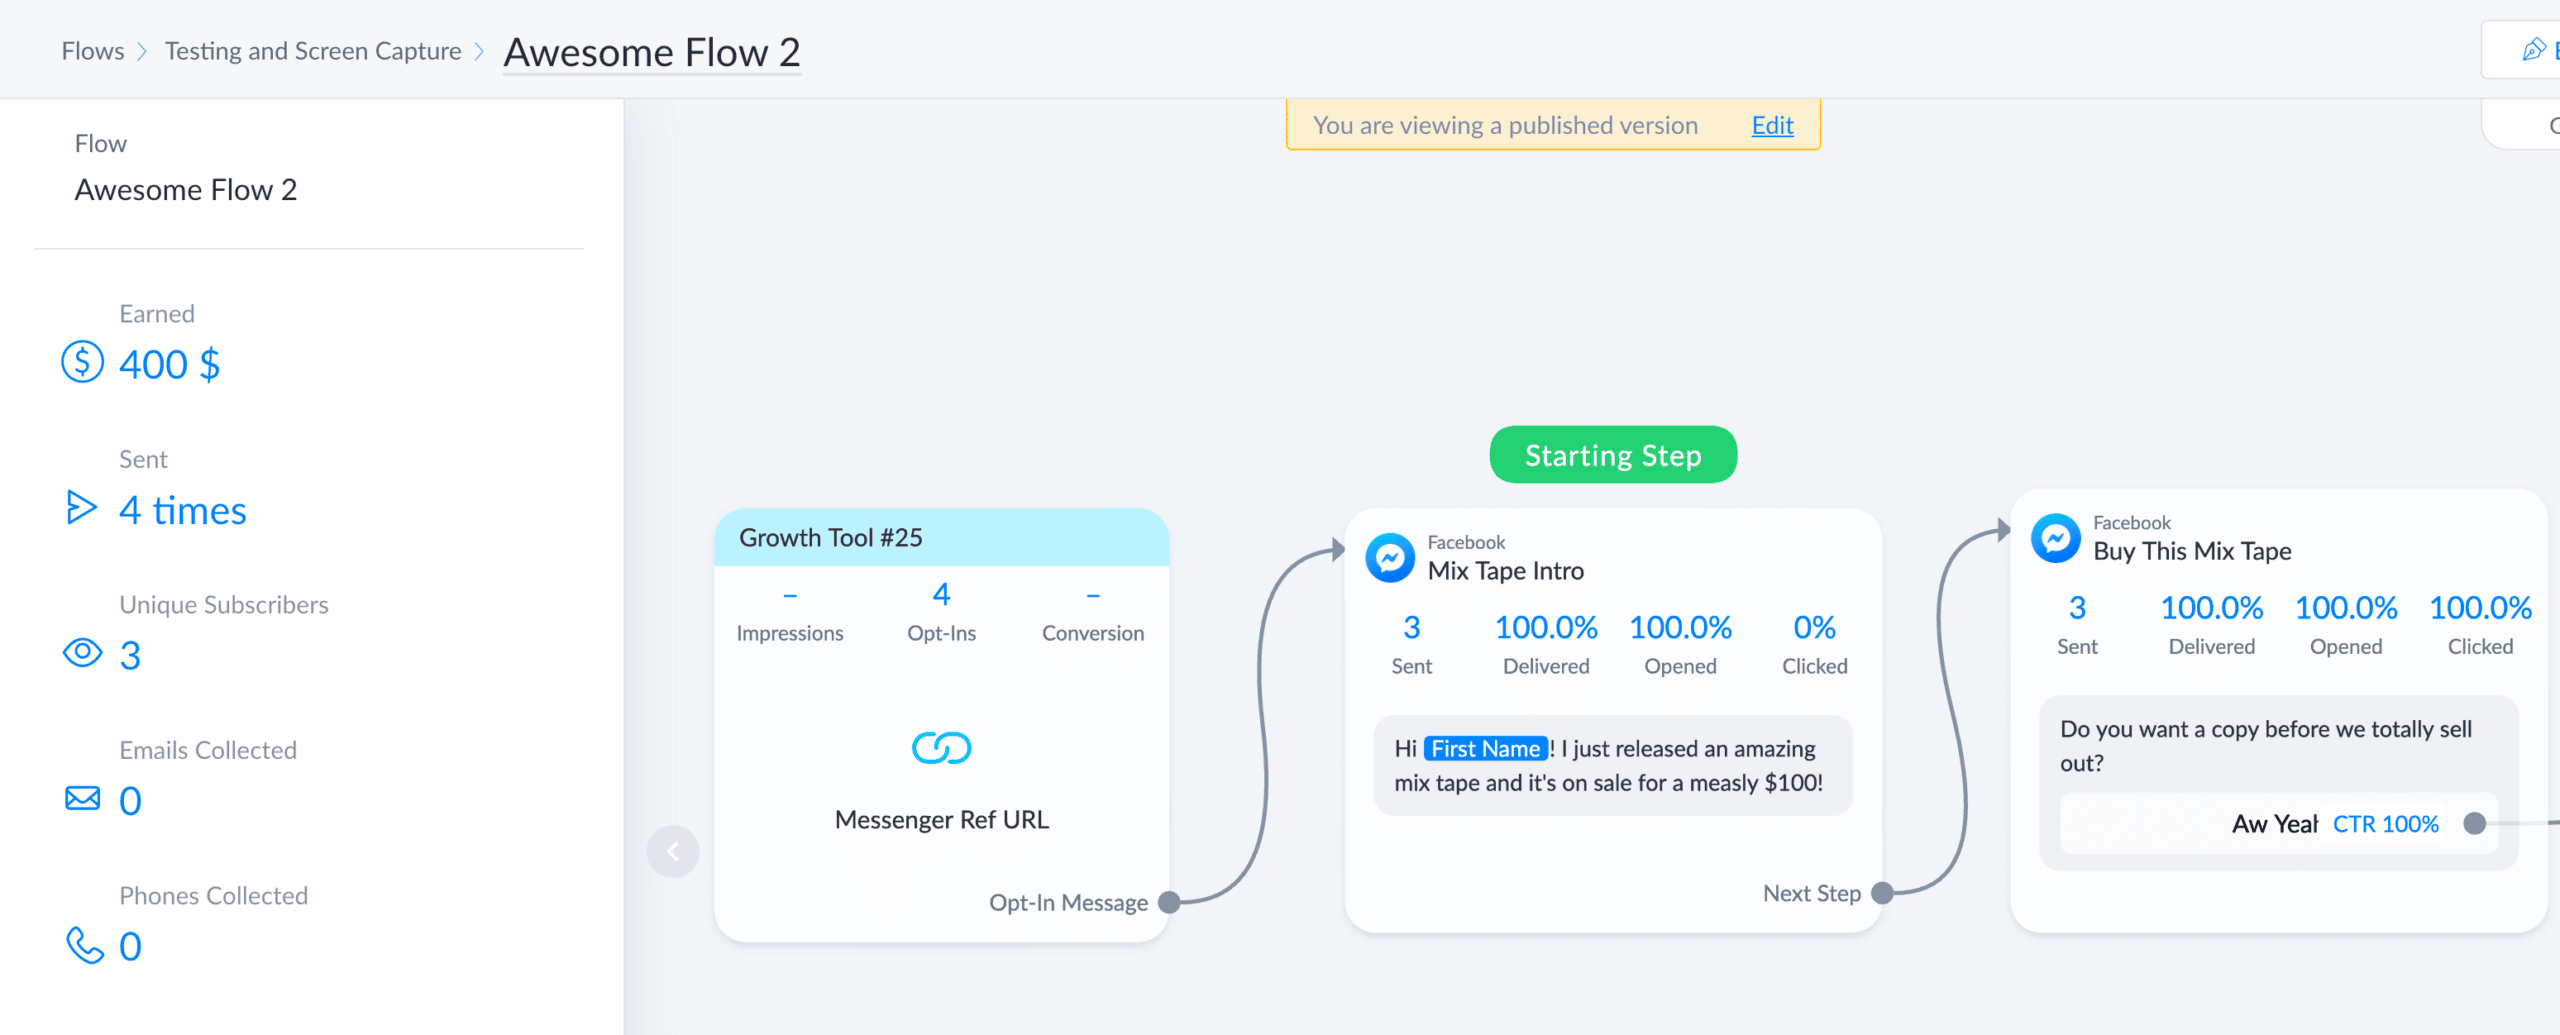
Beyond the overviews in your Dashboard, we’ve made it easier to look at earnings from individual flows. When looking at a published flow (but not in editing mode) you’ll be able to see summary statistics for the flow. This includes the total number of unique subscribers, the number of times it was sent, revenue earned, and contact information collected. Between these stats, you can quickly understand the overall value that a flow is generating for your business.
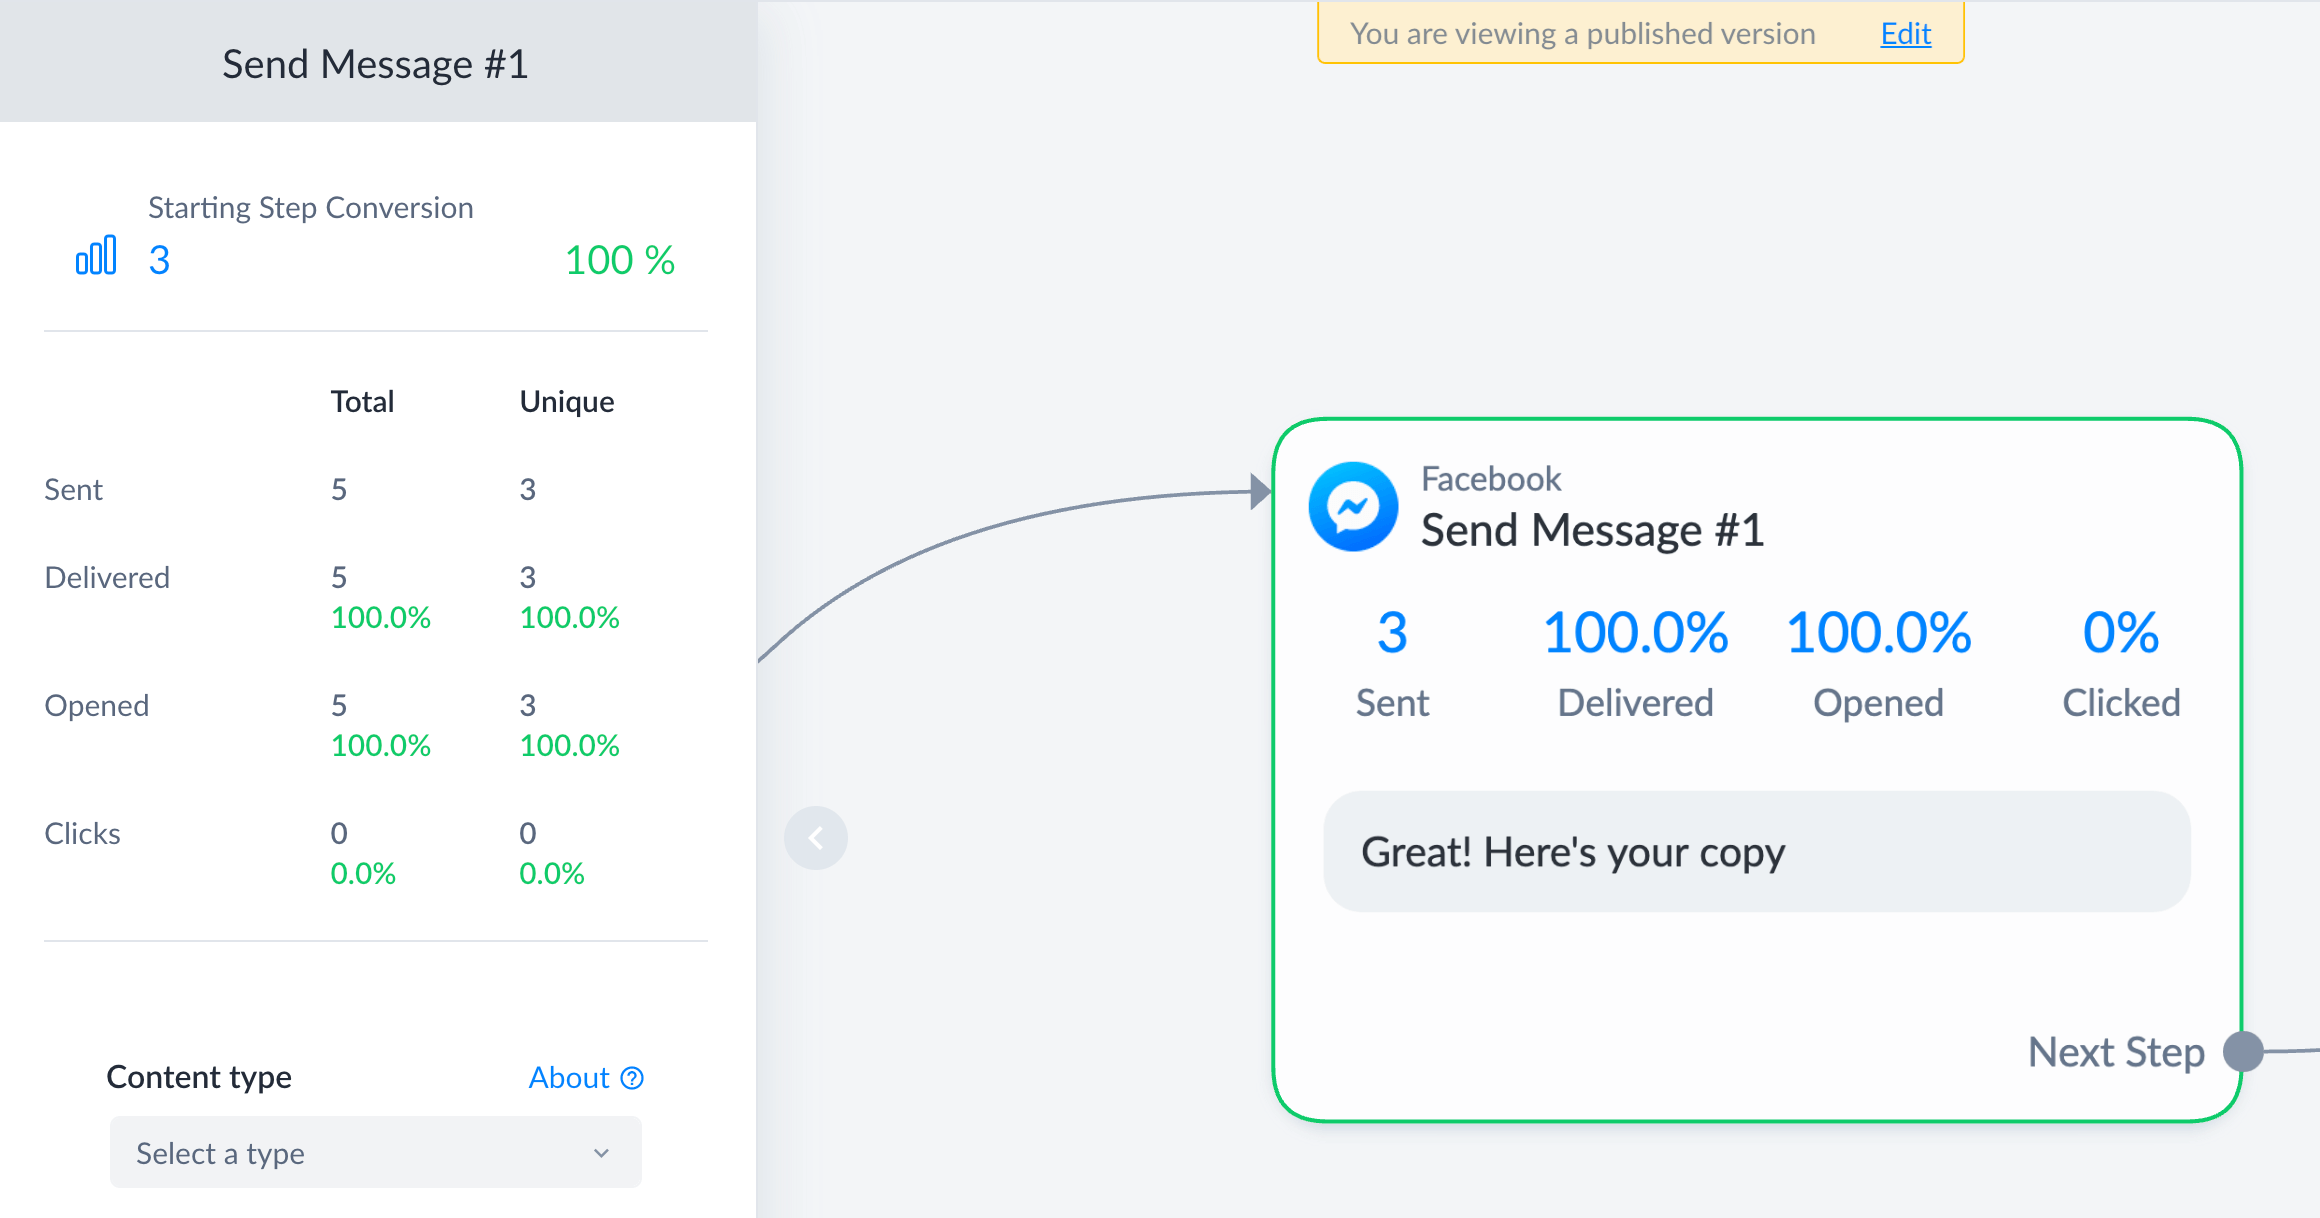
By clicking an individual message step, the statistics will update to include delivery rates, open rates, click rates, and a new metric we call “Starting Step Conversion Rate.” This gives the conversion for the number of people who reached a particular step after starting the flow. (The denominator here is the unique subscribers who started the flow, so if someone returns to the flow more than once and doesn’t convert, it won’t lower the conversion rate).
The Starting Step Conversion Rate is useful for comparing how different subscriber choices or A/B tests impact subscribers reaching a certain point in the flow. For example, say you’re measuring which coupon options motivate your subscribers to opt-in to receive content updates via SMS. You can run an A/B test inside of your flow with different incentive options, and then see how many people opt-in for each path.
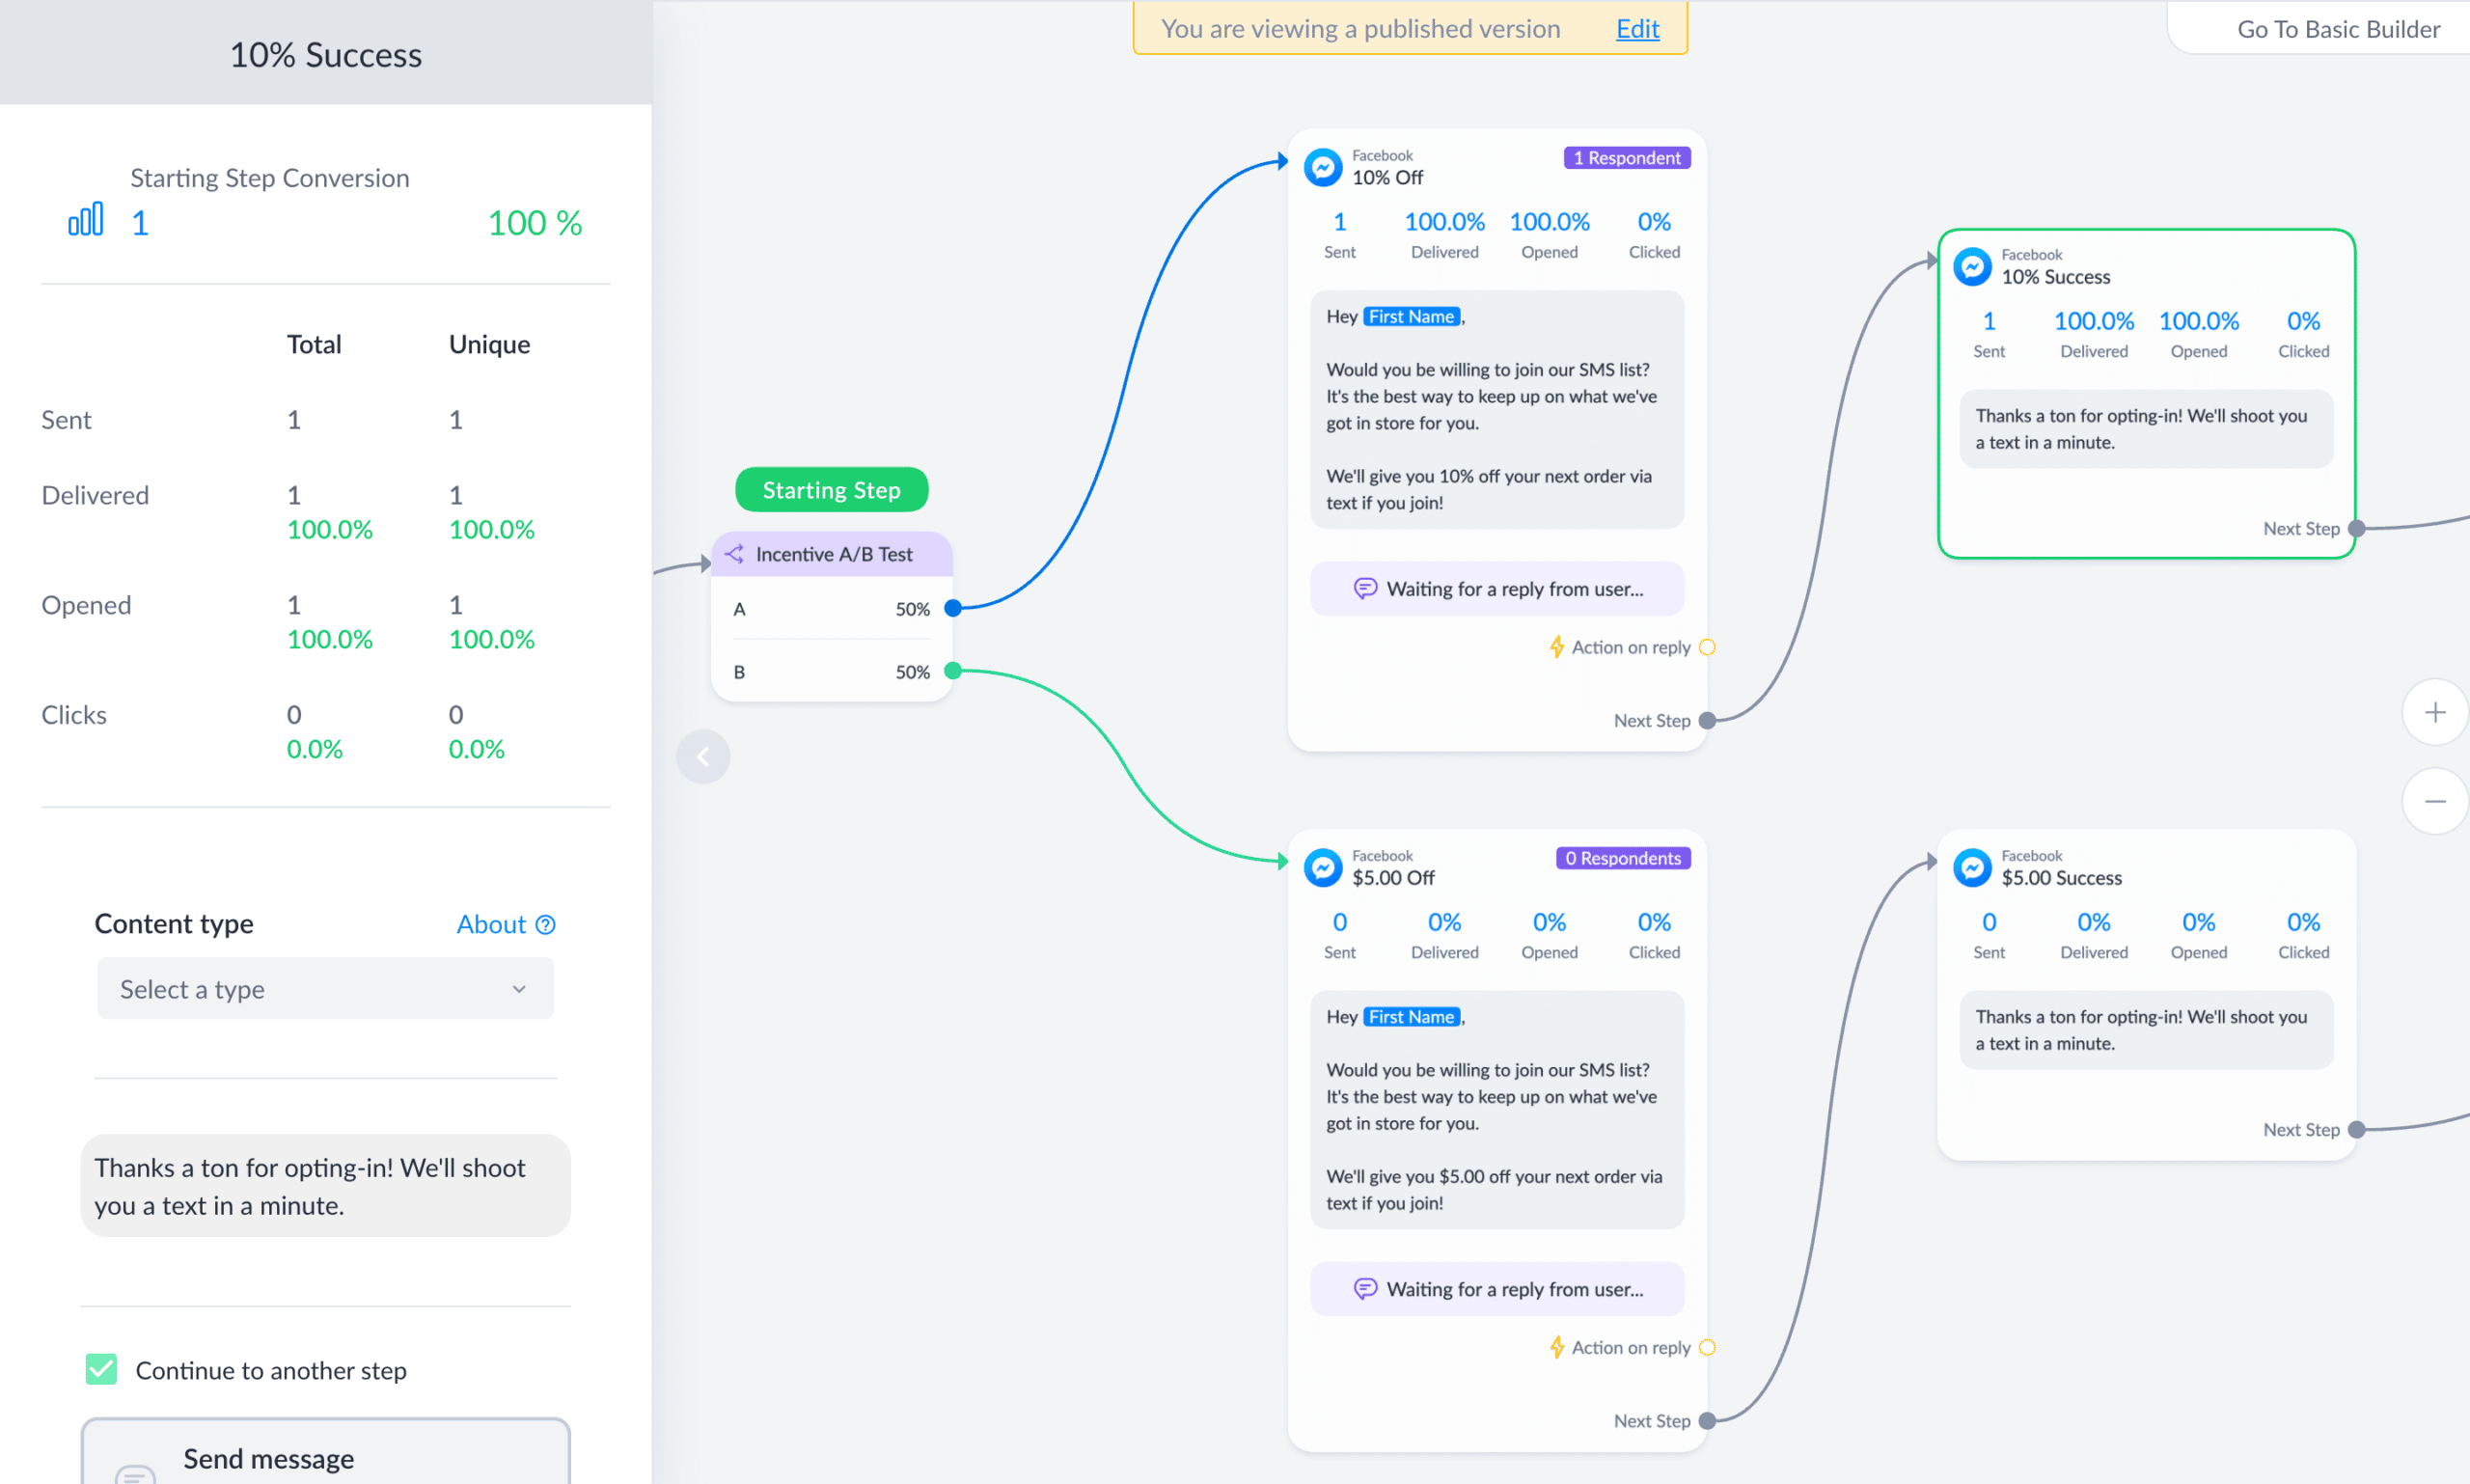
The example above is intentionally simple, but imagine if there were several steps on each path where users could drop off. As a flow grows in complexity, the Starting Step Conversion Rate becomes useful to quickly determine which paths are performing best.
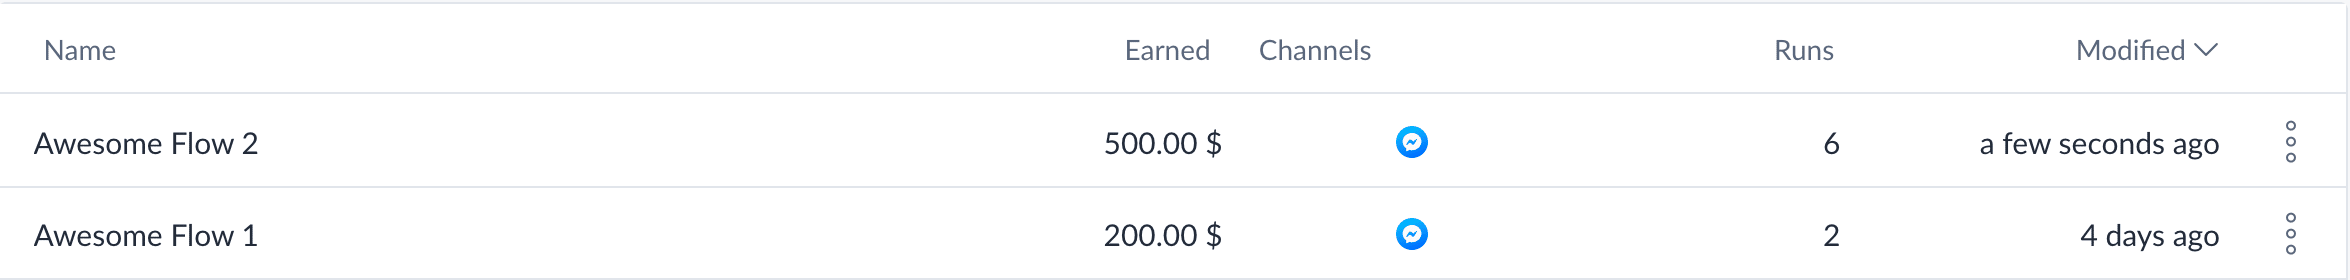
Finally, we’ve added an “earned” column to flow folders so that you can quickly compare the revenue generated between different flows.
More Coming Soon
All this is only the beginning! We plan to keep making Manychat Analytics more robust – and when we do we’ll come back to this article and update it to fit. Some items we’re working on right now to look forward to:
- Using Custom User Fields or Bot Fields as a conversion value inside of a custom conversion (Action steps).
- Using custom conversions as a part of Rule-based automation
Can’t get knee-deep in insights because you don’t have Manychat Pro? Upgrade today!


Originally published: Jan 28, 2020, Updated: Apr 24, 2020